
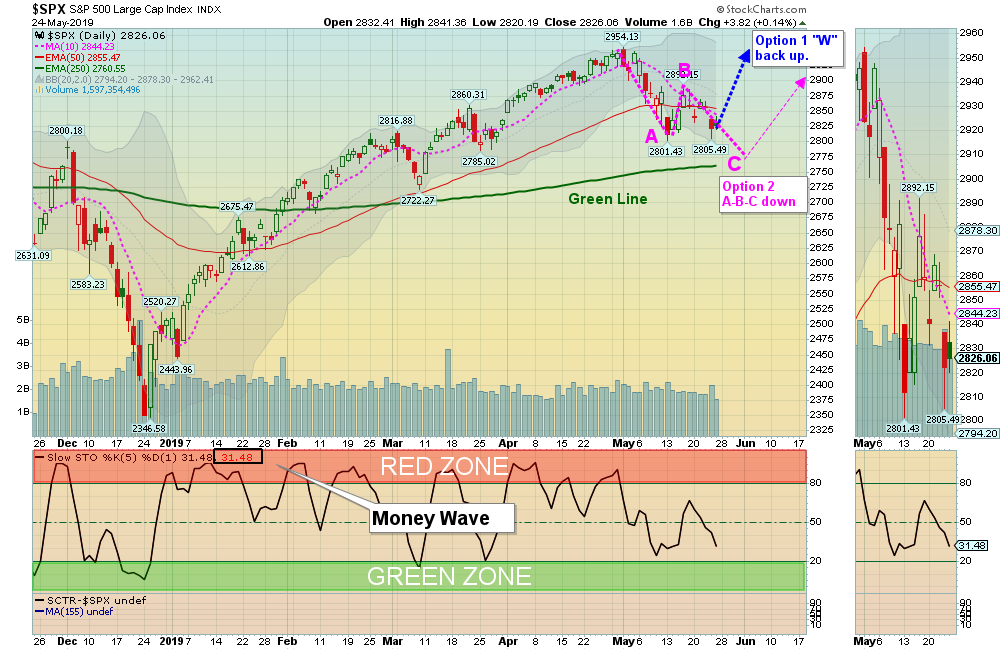
05/26/2019: Markets were down again for the week after failing to hold above the Pink Lines (10-day avgs.). If the Indices can hold above the recent Lows of 2801 soon, we could see a rally back up near the April Highs.
For the week the Dow was down 0.69%, the S&P 500 was down 1.07%, and the Nasdaq 100 was down 2.70%. The very Long Term Trend on the Stock Markets is UP.
The Inflation Index (CRB) was down 1.30% and is Below the Green Line, indicating Economic Weakness.
Bonds were up 1.42% for the week and are Above the Green Line, indicating Economic Weakness.
The US DOLLAR was down 0.38% and is over-bought after almost reaching a 3 year High.
Crude Oil was down 6.82% for the week at $58.63, and GOLD was down 0.62% at $1283.60.
___________________________________________________________________________________________
MONEY WAVE BUYS SOON:
We are currently in 4 logged Open Positions, for the Short & Medium Term. There are 6 Investments on the Short Term Watch List.
Be patient and WAIT for Green Zone Buy Signals!
______________________________________________________________________________________________
LONG TERM INVESTMENTS
Buy the Leading Investments that are down near the weekly Green Zones.
AES AES CORP. Wait for a Close above the Red Line of $16.91.
AU ANGLOGOLD LTD. Wait for a Close above the Red Line of $12.30.
CRON CRONOS GROUP Wait for a Close above the Red Line of $16.66.
DXCM DEXCOM INC. Wait for a Close above the Red Line of $122.59.
GLUU GLU MOBILE, INC. Wait for a Close above the Red Line of $9.77.
GRMN GARMIN LTD. Wait for a Close above the Red Line of $80.80.
LLY ELI LILLY & CO. Wait for a Close above the Red Line of $118.72.
XLNX XILINX INC. Wait for a Close above the Red Line of $116.53.
___________________________________________________________________________________________
Click for Portfolio (Open Positions)
Click for Watch List
Click for Closed Positions
Alert! Market Risk is MEDIUM (Yellow Zone). The probability of successful Short Term Trades is better, when the % of stocks above the 50-day avg. is below 20.
Tell your Friends about the Green Line, and Help Animals
___________________________________________________________________________________________
QUESTION: Mike R writes “Please point me to a page with step-by-step instructions for setup.”
ANSWER: Please follow the WATCH LIST on the Daily emails to see which Investments will have a Buy Signal soon.
Please follow the PORTFOLIO on the Daily emails to see which Investments have been bought, and the Sell Stop Loss Exit prices.
Please follow the CLOSED POSITIONS on the Daily emails to see that past results of recent trades.
Most subscribers just follow the “BUYS TODAY” and “SELLS TODAY” sections in the Daily emails, and you will be current with the changes.
Charts are found by clicking on the symbol links and green dots on the pages above.
Good trading, and tell your friends!


