
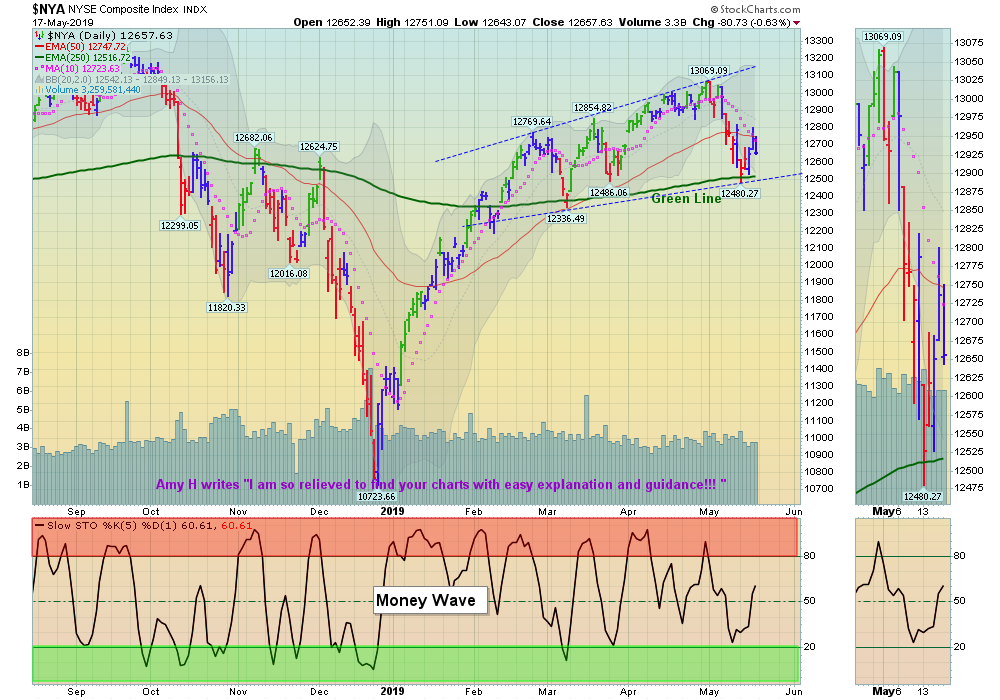
05/019/2019: Markets were down for the week after bouncing off the Lows on Monday. Most of the Indices stalled on Thursday after rallying up to the Pink Lines (10-day avgs.), which is normal. If the Indices can hold above last Monday’s Lows soon, we could see a rally back up near the April Highs.
For the week the Dow was down 0.69%, the S&P 500 was down 0.78%, and the Nasdaq 100 was down 1.09%. The very Long Term Trend on the Stock Markets is UP.
The Inflation Index (CRB) was up 1.14% and is Below the Green Line, indicating Economic Weakness.
Bonds were up 0.99% for the week and are Above the Green Line, indicating Economic Weakness.
The US DOLLAR was up 0.76% and is over-bought.
Crude Oil was up 2.04% for the week at $62.92, and GOLD was down 0.91% at $1276.
___________________________________________________________________________________________
MONEY WAVE BUYS SOON:
We are currently in 6 logged Open Positions, for the Short & Medium Term. There are 3 Investments on the Short Term Watch List.
Be patient and WAIT for Green Zone Buy Signals!
______________________________________________________________________________________________
LONG TERM INVESTMENTS
Buy the Leading Investments that are down near the weekly Green Zones.
AES AES CORP. Wait for a Close above the Red Line of $17.00.
AU ANGLOGOLD LTD. Wait for a Close above the Red Line of $12.44.
AVP AVON PRODUCTS Buy if is Closes above $3.41 on High Volume.
CRON CRONOS GROUP Wait for a Close above the Red Line of $16.93.
DXCM DEXCOM INC. Wait for a Close above the Red Line of $123.64.
GLUU GLU MOBILE, INC. Wait for a Close above the Red Line of $10.04.
LLY ELI LILLY & CO. Wait for a Close above the Red Line of $119.12.
XLNX XILINX INC. Wait for a Close above the Red Line of $119.53.
___________________________________________________________________________________________
Click for Portfolio (Open Positions)
Click for Watch List
Click for Closed Positions
Alert! Market Risk is MEDIUM (Yellow Zone). The probability of successful Short Term Trades is better, when the % of stocks above the 50-day avg. is below 20.
Tell your Friends about the Green Line, and Help Animals
___________________________________________________________________________________________
QUESTION: Jerry S. writes “How do I know when to Sell?”
ANSWER: Hi Jerry. Please follow the Rules for Selling below based on the Time Frame that you want to be in the Investment:
- Short Term: Sell when it Closes below the 10-day avg.
- Medium Term: Sell when it Closes below the 50-day avg.
- Long Term: Sell when it Closes below the Green Line (250-day avg).
Or Follow the PORTFOLIO (please click) on your daily emails.
Good trading, and tell your friends!


