Above the Green Line -01
  • Market Insights
        • Commentary
          • Daily
          • Weekly
        • BUY / SELL SIGNALS
          • Trade Posts
          • Recent Trade Alerts
          • Recent Day Trades
        • BLOGROLL
          • Dividend Growth Blog
          • ETF Sector Blog
          • Dow Dogs
          • TPOW Blog
  • Strategies
        • SWING TRADING
          • Current Positions
          • Watchlists
          • Closed Positions
          • Candidates - TOP 100
          • Specialty Stocks
        • WEEKLY STOCK PICK
          • TPOW Charts
          • TPOW Performance
          • TPOW Strategy Guide
          • TPOW Performance Dashboard
        • DAY TRADING
          • Watch List
        • ATGL DASHBOARD
        • ETF STRATEGIES
          • ETF Sector Rotation
          • ETF Sector Portfolio
        • DIVIDEND GROWTH
          • Dividend Growth Portfolio
          • Dividend Calendar
        • DOGS OF THE DOW
          • Dogs of the Dow Portfolio
          • DOW 5 Portfolio
  • Markets
        • US MARKET
          • Commodities
          • Energy
          • Precious Metals
          • Volatility
        • GLOBAL MARKETS
          • Market Indices
          • Economic Calendar
          • FOREX Heat Map
          • FOREX Cross Rates
          • Crypto Currency Market
  • Investing
    • Discord Community
    • Dashboard
  • Resources
        • ARTICLES
          • Dividend Growth Model Articles
          • ETF Articles
          • Investment Strategies Articles
          • Market and Economic Insights
          • Stock Trade Articles
          • Stock Reviews
        • TOOLS
          • Stock Scanners
          • Charting Software
          • Brokerage Firms
        • STOCK CHARTS
          • Key Components
          • Reading Charts
          • Drawing Stock Charts
          • Identifying Trends
        • RETIREMENT PLANNING
  • About
    • Contact Us
    • How to Win
    • #1 At Stockcharts
    • Disclaimer
    • FAQ
  • Log In
  • Subscribe

May 12, 2019

Green Line Weekly May 12, 2019

QQQ Chart
NASDAQ 100 is bouncing up off the 50-day avg. (Red Line).


HAPPY MOTHER’S DAY

05/012/2019:  Markets were down for the week as the major Indices stalled at the Sept. Highs (Resistance). Then the Indices dropped and returned back down to the Green Zones for Money Wave Buy Signals soon. This is a perfectly normal pull-back.

For the week the Dow was down 2.12%, the S&P 500 was down 2.02%, and the Nasdaq 100 was down 3.30%.  The very Long Term Trend on the Stock Markets is UP.  

The Inflation Index (CRB) was down 1.55% and is Below the Green Line, indicating Economic Weakness.

Bonds were up 0.88% for the week and are Above the Green Line, indicating Economic Weakness.

The US DOLLAR was down 0.04% and is over-bought. 

Crude Oil was down 0.45% for the week at $61.66, and GOLD was up 0.48%  at $1288.

___________________________________________________________________________________________

MONEY WAVE BUYS SOON:   

We are currently in 4 logged Open Positions, for the Short & Medium Term.  There are 11 Investments on the Short Term Watch List. 

Be patient and WAIT for Green Zone Buy Signals!

______________________________________________________________________________________________

LONG TERM TRADES 

Buy the Leading Investments that are down near the weekly Green Zones.   

AES    AES CORP.    Wait for a Close above the Red Line of $17.17.   

AU    ANGLOGOLD LTD.  Wait for a Close above the Red Line of $12.61.   

AVP    AVON PRODUCTS      Buy if is Closes above $3.41 on High Volume.   

BSX   BOSTON SCIENTIFIC    Wait for a Close above the Red Line of $37.41.   

CRON    CRONOS GROUP    Wait for a Close above the Red Line of $17.36.   

DXCM   DEXCOM INC.    Wait for a Close above the Red Line of $124.65.   

KTOS   KRATOS DEFENSE   Blew Out this week up, 19% on Earnings. Wait for next Daily Green Zone Buy Signal.     

LLY    ELI LILLY & CO.    Wait for a Close above the Red Line of $120.66.   


___________________________________________________________________________________________


Click for  Portfolio (Open Positions)  
Click for  Watch List
Click for  Closed Positions


Alert! Market Risk is MEDIUM (Yellow Zone). The probability of successful Short Term Trades is better, when the % of stocks above the 50-day avg. is below 20. 

Tell your Friends about the Green Line, and Help Animals

___________________________________________________________________________________________

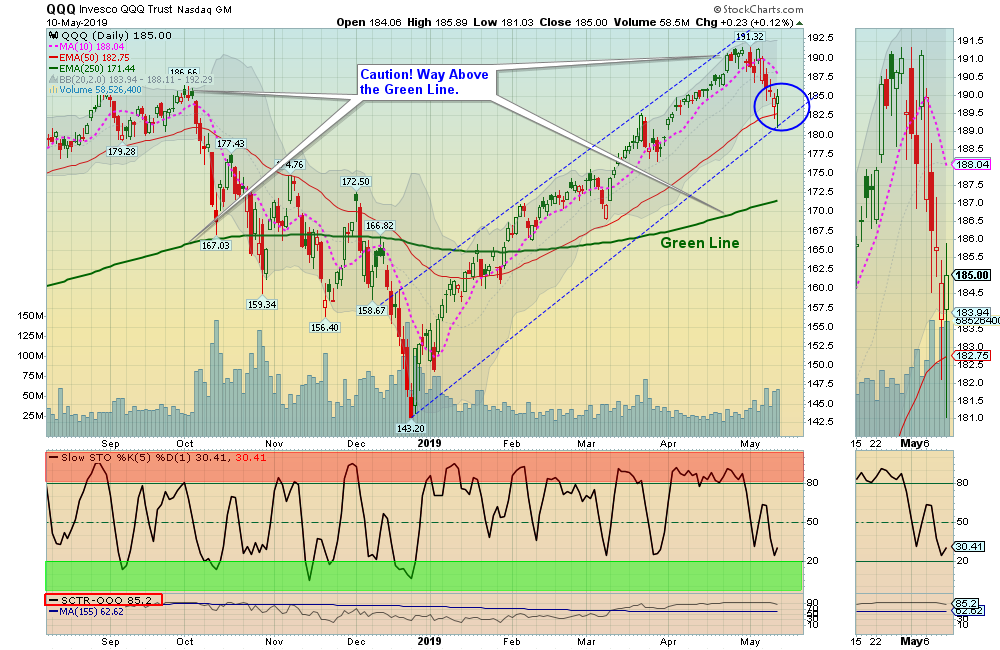
QUESTION:  Nancy writes  “I would like to know where the relative strength factor is located on the charts.”

ANSWER:  Hi Nancy, the Relative Strength is usually on the bottom left of each Chart  with a Red Box around it (SCTR is StockCharts Technical Rank).  Sometimes we use data from:

Relative Strength Values comes from the SCTR Rank (StockCharts Technical Rank), www.etfscreen.com for ETFs , and Investor’s Business Daily (IBD) for stocks. We prefer the longer term weighting used by www.etfscreen.com and IBD.

Sometimes look for Big Numbers with circle around them…

Good trading, and tell your friends!

Related Post

– Green Line Weekly May 5, 2019

Subscribe to Our Newsletter

AGL Logo

Get our eBook Now!

Candlestick - A Swing Traders Friend

We don’t spam! Read our privacy policy for more info.

You’ve been successfully subscribed to our newsletter!

Voted #1 at Stock Charts

SH Chart
Inverse S&P 500 Fund (SH) will have a Money Wave Buy today.

Help Us Help Animals

Help Us Help Animals

Recent Comments

  • Market Breadth Indicators: A Trader’s Guide to Early Trend Detection on Backtesting: Definition and How a Trading Strategy Backtest Works
  • Island Reversal Pattern: Definition and Formation Explained on Double Top Pattern: How to Identify and Trade This Reversal Signal
  • Channel Pattern Guide: What It Is and Why It Matters on A Guide to Forecasting Using Moving Averages
  • What Is a Broadening Bottom Chart Pattern? Full Guide on Bull vs. Bear Market: An Investor’s Guide to Market Phases
  • ATGL Weekly Money Flow - 2025-05-11 on ATGL Top Pick of the Week! Apr 6, 2025

Become a Green Liner!

Help me make more Money in the Stock Market.

ON ATGL

  • DashBoard
  • Weekly Commentary
  • Daily Buy / Sell Signals
  • Day Trade Setup
  • Trading Rooms

Design & Develop By Pixelvect

STRATEGIES

  • Swing Trading
  • ATGL Pick of the Week
  • Dividend Growth
  • ETF Sector Rotation
  • Dogs of the Dow

HELP

  • ATGL Trading Rules
  • FAQ
  • Account Maintenance
  • Contact US
  • Join

FOLLOW US

Instagram Linkedin Twitter Facebook

© COPYRIGHT 2024 · ABOVETHEGREENLINE.COM · ALL RIGHTS RESERVED · PRIVACY · TERMS · CONTACT · WATCHLIST · CURRENT