
05/05/2019: Markets were up slightly for the week as the major Indices are back up at the Sept. Highs (Resistance), and many Indices are Way Above the Green Lines.
New Subscribers: please be patient and WAIT for opportunities. The Markets have rallied 25 % up from the Dec. Lows, and all Investments will eventually return to their Green Lines…
For the week the Dow was down 0.14%, the S&P 500 was up 0.21%, and the Nasdaq 100 was up 0.24%. The very Long Term Trend on the Stock Markets is UP.
The Inflation Index (CRB) was down 1.56% and is Below the Green Line, indicating Economic Weakness.
Bonds were up 0.09% for the week and are Above the Green Line, indicating Economic Weakness.
The US DOLLAR was down 0.57% and is over-bought.
Crude Oil was down 2.15% for the week at $61.94, and GOLD was down 0.58% at $1281.
___________________________________________________________________________________________
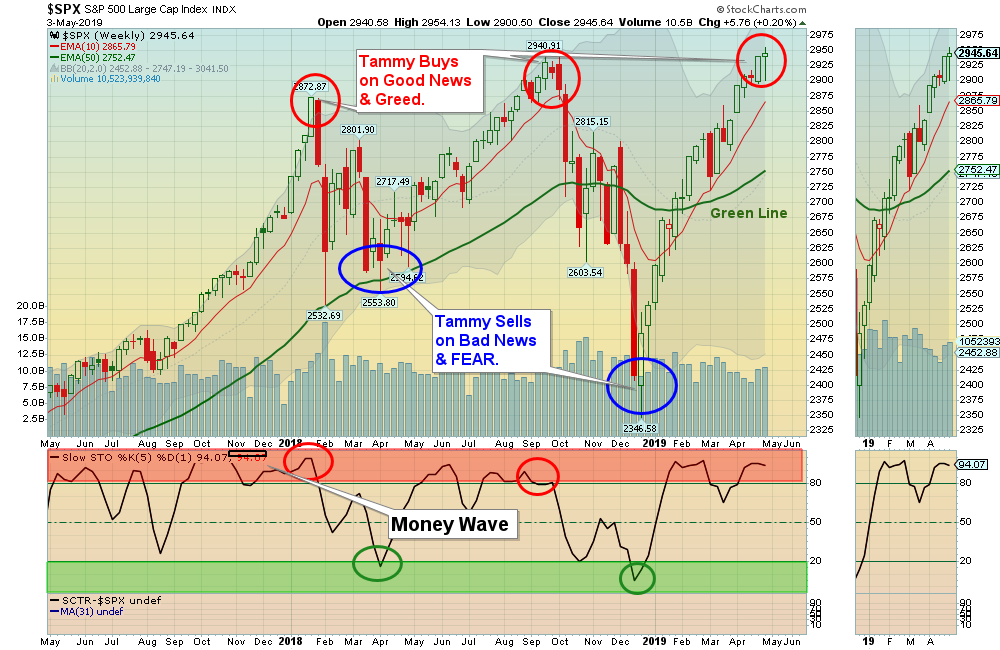
MONEY WAVE BUYS SOON:
We are currently in 6 logged Open Positions, for the Short & Medium Term. There are 5 Investments on the Short Term Watch List.
Be patient and WAIT for Green Zone Buy Signals!
______________________________________________________________________________________________
LONG TERM TRADES
Buy the Leading Investments that are down near the weekly Green Zones.
AU ANGLOGOLD LTD. Wait for next Daily Green Zone Buy Signal.
AVP AVON PRODUCTS Buy if is Closes above $3.41 on High Volume.
BSX BOSTON SCIENTIFIC Wait for a Close above the Red Line of $37.52.
DXCM DEXCOM INC. Wait for a Close above the Red Line of $125.87.
KTOS KRATOS DEFENSE Wait for next Daily Green Zone Buy Signal.
LLY ELI LILLY & CO. Wait for a Close above the Red Line of $121.70.
MEET THE MEET GROUP Try to Buy near the Red Line around $5.40.
___________________________________________________________________________________________
Click for Portfolio (Open Positions)
Click for Watch List
Click for Closed Positions
Alert! Market Risk is HIGH (Red Zone). The probability of successful Short Term Trades is better, when the % of stocks above the 50-day avg. is below 20.
Tell your Friends about the Green Line, and Help Animals
___________________________________________________________________________________________
QUESTION: Michael C. writes “Thanks for sharing your methodology on StockCharts. I’ve been having a look and noticed that today’s comment says “Please WAIT for the Leaders to return back down to the Green Zones for Money Wave Buys soon”.
Does this mean that no Money Wave Buy signals should be taken until the Leaders have returned back to the Green Zones?
ANSWER: Money Wave Buy Signals can be taken at any time, but results are usually better when the Strongest Leaders and the S&P 500 Index are ALSO down in their Green Zones. (The weakest ones go down to their Green Zones first).
Good trading, and tell your friends!


