Above the Green Line -01
  • Market Insights
        • Commentary
          • Daily
          • Weekly
        • BUY / SELL SIGNALS
          • Trade Posts
          • Recent Trade Alerts
          • Recent Day Trades
        • BLOGROLL
          • Dividend Growth Blog
          • ETF Sector Blog
          • Dow Dogs
          • TPOW Blog
  • Strategies
        • SWING TRADING
          • Current Positions
          • Watchlists
          • Closed Positions
          • Candidates - TOP 100
          • Specialty Stocks
        • WEEKLY STOCK PICK
          • TPOW Charts
          • TPOW Performance
          • TPOW Strategy Guide
          • TPOW Performance Dashboard
        • DAY TRADING
          • Watch List
        • ATGL DASHBOARD
        • ETF STRATEGIES
          • ETF Sector Rotation
          • ETF Sector Portfolio
        • DIVIDEND GROWTH
          • Dividend Growth Portfolio
          • Dividend Calendar
        • DOGS OF THE DOW
          • Dogs of the Dow Portfolio
          • DOW 5 Portfolio
  • Markets
        • US MARKET
          • Commodities
          • Energy
          • Precious Metals
          • Volatility
        • GLOBAL MARKETS
          • Market Indices
          • Economic Calendar
          • FOREX Heat Map
          • FOREX Cross Rates
          • Crypto Currency Market
  • Investing
    • Discord Community
    • Dashboard
  • Resources
        • ARTICLES
          • Dividend Growth Model Articles
          • ETF Articles
          • Investment Strategies Articles
          • Market and Economic Insights
          • Stock Trade Articles
          • Stock Reviews
        • TOOLS
          • Stock Scanners
          • Charting Software
          • Brokerage Firms
        • STOCK CHARTS
          • Key Components
          • Reading Charts
          • Drawing Stock Charts
          • Identifying Trends
        • RETIREMENT PLANNING
  • About
    • Contact Us
    • How to Win
    • #1 At Stockcharts
    • Disclaimer
    • FAQ
  • Log In
  • Subscribe

February 22, 2022

Money Wave Alert! Feb 22, 2022

DIA Chart
Waiting to see if the DOW 30 Index (DIA) will have a “W” pattern.

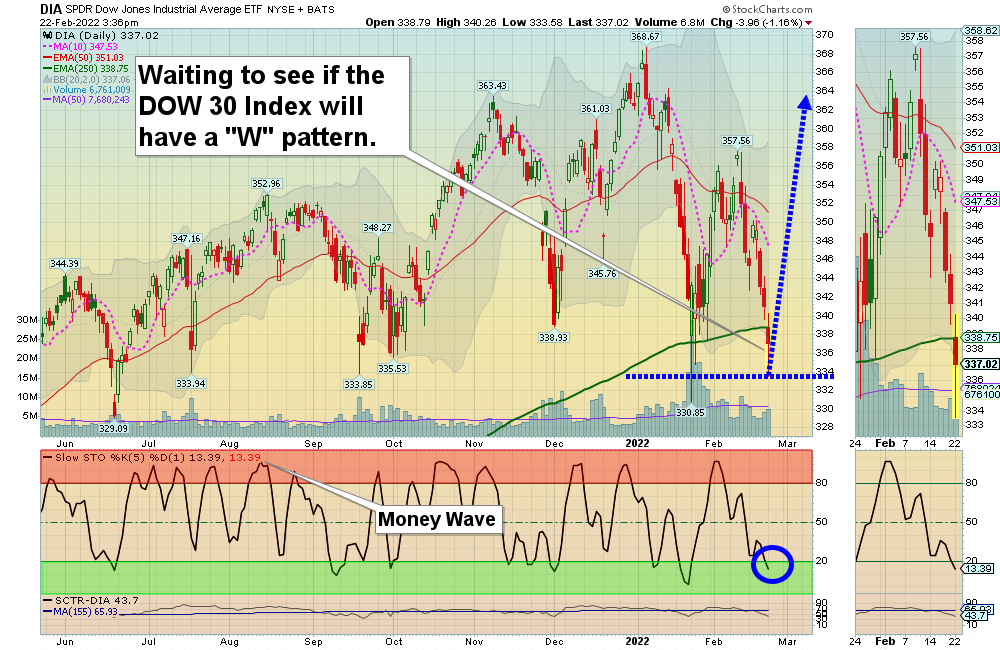
Markets were lower again today on more FEAR Selling, and some of the weaker Stocks have really been trashed. Most of the major Indices are slightly Below the Green Lines, but the S&P 500 Index is still trying to hold. Support is the previous January low of 4222. We are waiting to see if the Stock Indices can hold at the lows of January for a possible “W” pattern. We should know that when the Volume picks up, and it will probably be on a Good News story.  We have raised plenty on CASH to Buy soon.

Many are worried that the FED is going to tighten, or raise short term Interest Rates in March. Probably, but tightening should slow down inflation and long term T-Bonds should like that, and rally back up near their Green Lines. This would normally cause long term Interest to DECLINE, which should improve stock prices, and hurt Commodities.

New Subscribers:  The Watch List should be ready soon for Buy Signals as the strongest Energy & Bank stocks are back down to the Green Zones.  Please WAIT for Money Wave Buy Signals soon. BUYS SOON – CHARTS  The best moves are when the S&P 500 Index is also coming up out of the Green Zone. (Like now!)

BUYS TODAY    2/22/2022    NONE TODAY


BUYS TOMORROW – JUMP START STOCKS  Shop for a better price earlier in the day. Only use Jump Start on the same day that a Daily Money Wave Buy Signal will occur.       

VLO      VALERO ENERGY CORP.      Wait for Money Wave Close > 20 with High Volume.

XLF      FINANCIAL FUND      Buy above $39.55 with High Volume with a 3% Trailing Sell Stop Loss below it.

BUYS SOON – CHARTS      WATCH LIST

CVS      CVS HEALTH CORP.       Buy above the Pink Line around $104.14 with High Volume with a 5% Trailing Sell Stop Loss below it.

DB      DEUTSCHE BANK AG      Wait for Money Wave Close > 20 with High Volume.

WFC      WELLS FARGO & CO.      Wait for Money Wave Close > 20 with High Volume.     

XLK      TECH FUND      Buy above the Pink Line around $156.94 with High Volume with a 3% Trailing Sell Stop Loss below it.

XOM      EXXON MOBILE CORP.      Money Wave must Close in the Green Zone.   

Please be patient and wait for Money Wave Buy Signals.  We will email you when they are ready. Follow on the WATCH LIST.      
The Leaders are Way Above the Green Lines (all Investments eventually return to their Green Lines).

SELLS TODAY      

TSCDY      TESCO PLC      EXIT if it is going to Close below Support of $11.75.  This trade was not logged.

_________________________________________________________________________________________________________________

DAY TRADING SETUPS.  A few Triple Buy Pops today: DWAC (+11%) M (+4%) PHUN (+8%) & VIX (+10%).  Try out the New Side by Side layout.   

DAY TRADING FOR INDICES & LARGE CAPS CHARTS.

Bonds  were mixed today, and are Below the Green Line.     

Crude Oil was up $1.35 today at $91.56.

_________________________________________________________________________________________________________________

MY TRADING DASHBOARD 
SWING TRADING CURRENT POSITIONS
DAY TRADING SETUPS
TRADE ALERTS
ARE YOUR INVESTMENTS ABOVE THE GREEN LINE?
GREEN LINE RULES
ETF SECTOR ROTATION SYSTEM   
New TOP 100 LIST Updated Feb 1, 2022

Many like to Buy the Swing Trades just before the Close, if the Money Wave is going to create a Buy Signal (Closing > 20 and up out of the Green Zone).

Don’t Buy if the Investment has already popped up too much. Money Wave Buy Signals are usually good for a 3-6 %  move in a few days.

We will “Not Log” trades if the Reward/Risk is not at least 2:1, or Low Volume. These have more risk.

Related Post

– VLO

– Money Wave Alert! Feb 21, 2022

Subscribe to Our Newsletter

AGL Logo

Get our eBook Now!

Candlestick - A Swing Traders Friend

We don’t spam! Read our privacy policy for more info.

You’ve been successfully subscribed to our newsletter!

Voted #1 at Stock Charts

SH Chart
Inverse S&P 500 Fund (SH) will have a Money Wave Buy today.

Help Us Help Animals

Help Us Help Animals

Recent Comments

  • Market Breadth Indicators: A Trader’s Guide to Early Trend Detection on Backtesting: Definition and How a Trading Strategy Backtest Works
  • Island Reversal Pattern: Definition and Formation Explained on Double Top Pattern: How to Identify and Trade This Reversal Signal
  • Channel Pattern Guide: What It Is and Why It Matters on A Guide to Forecasting Using Moving Averages
  • What Is a Broadening Bottom Chart Pattern? Full Guide on Bull vs. Bear Market: An Investor’s Guide to Market Phases
  • ATGL Weekly Money Flow - 2025-05-11 on ATGL Top Pick of the Week! Apr 6, 2025

Become a Green Liner!

Help me make more Money in the Stock Market.

ON ATGL

  • DashBoard
  • Weekly Commentary
  • Daily Buy / Sell Signals
  • Day Trade Setup
  • Trading Rooms

Design & Develop By Pixelvect

STRATEGIES

  • Swing Trading
  • ATGL Pick of the Week
  • Dividend Growth
  • ETF Sector Rotation
  • Dogs of the Dow

HELP

  • ATGL Trading Rules
  • FAQ
  • Account Maintenance
  • Contact US
  • Join

FOLLOW US

Instagram Linkedin Twitter Facebook

© COPYRIGHT 2024 · ABOVETHEGREENLINE.COM · ALL RIGHTS RESERVED · PRIVACY · TERMS · CONTACT · WATCHLIST · CURRENT