Above The Green Line

  • Commentary
    • BUY / SELL SIGNALS
      • Stock Alerts
    • DIVGRO BLOG
    • ETF SECTOR BLOG
    • DOW DOGS BLOG
    • NEWS
    • STOCK IDEAS
  • Strategies
    • SWING TRADING
      • CURRENT POSITIONS
      • WATCHLISTS
      • CLOSED POSITIONS
      • CANDIDATES – TOP 100
      • SPECIALTY STOCKS
    • DAY TRADING
      • Watch List
    • DIVIDEND GROWTH
      • Dividend Growth Portfolio
      • Dividend Calendar
    • DOGS OF THE DOW
      • Dogs of the Dow Portfolio
      • DOW 5 Portfolio
    • ETF SECTOR ROTATION
      • ETF Sector Portfolio
  • Markets
    • US MARKET
      • Commodities
      • Energy
      • Precious Metals
      • Volatility
    • GLOBAL MARKETS
      • MARKET INDICES
      • ECONOMIC CALENDAR
      • FOREX HEAT MAP
      • FOREX CROSS RATES
      • CRYPTOCURRENCY MARKET
    • DASHBOARD
    • IDEAS
  • Investing
    • FORUM
  • Resources
    • ARTICLES
    • WEEKLY STOCK
    • RETIREMENT PLANNING
    • BLOGROLL
    • FAQ
  • About
    • CONTACT US
    • HOW TO WIN
    • #1 AT STOCKCHARTS
  • Log In
  • Subscribe

February 21, 2022

Money Wave Alert! Feb 21, 2022

SPY Chart

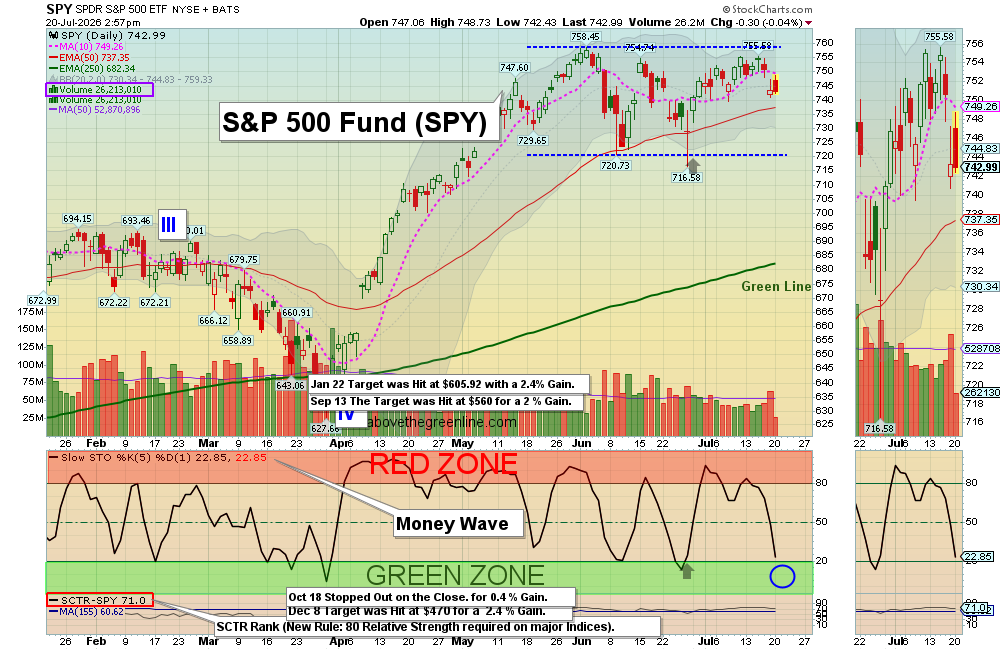
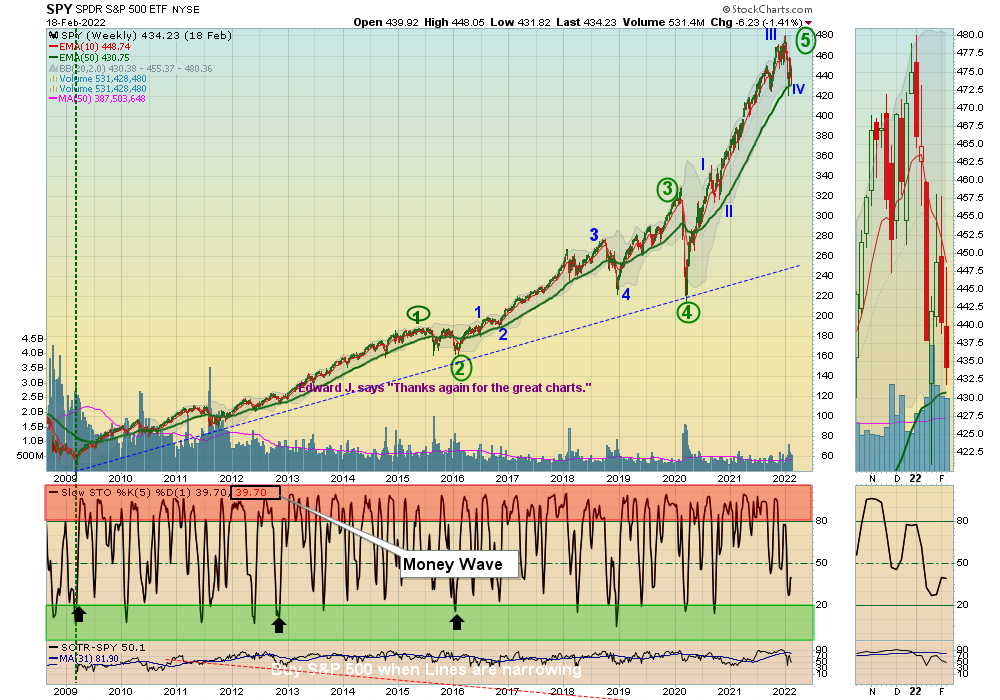
The S&P 500 Chart is still Bullish, but in January it was Way Above the Green Line.


From subscriber Masao:

“Hi Above Green. Thank you for information. 

I follow Wave 3 up idea (Click for CHART). However, if goes beyond the last low, I will loss cut all. 

I only looking for your strong chart now for Wave 3.”


REPLY:

Yes Masao, Wave 2 down is normally about a 5/8 retracement of Wave 1 up, on lower Volume (but can be up to 100%).

If the Wave 2 down exceeds more than100% of Wave 1 up, then our Elliott Wave Count is probably wrong…

The only problem with the S&P Chart in January (see Chart above) was that it was over-bought (Way Above the Green Line).  Investments are Bullish Above the Green Line.


HAPPY HOLIDAY!


Posted By AbovetheGreenLine at 11:54 am Leave a Comment Tagged With: premium

Leave a Reply Cancel reply

You must be logged in to post a comment.

Voted #1 at Stock Charts

SH Chart
Inverse S&P 500 Fund (SH) will have a Money Wave Buy today.

Help Us Help Animals

Help Us Help Animals

Recent Comments

  • Money Wave Alert! Mar 29, 2023 – InvFuture Education on Money Wave Alert! Mar 29, 2023
  • Money Wave Alert! Mar 28, 2023 – InvFuture Education on Money Wave Alert! Mar 28, 2023
  • Viking Thera. (VKTX) up 58% today. – InvFuture Education on Viking Thera. (VKTX) up 58% today.
  • Money Wave Alert! Mar 27, 2023 – InvFuture Education on Money Wave Alert! Mar 27, 2023
  • Green Line Weekly! Mar 26, 2023 – InvFuture Education on Green Line Weekly! Mar 26, 2023

Become a Green Liner!

Help me make more Money in the Stock Market.

Above the Green Line

ON ATGL

  • Weekly Commentary
  • Intraday Buy / Sells
  • Day Trade Setup

STRATEGIES

  • Swing Trading
  • Dividend Growth
  • ETF Sector Rotation
  • Dogs of the Dow

HELP

  • ATGL Trading Rules
  • FAQ
  • Account Maintenance
  • Contact US

© Copyright 2021 · AboveTheGreenLine.com · All Rights Reserved · Privacy · Terms · Contact · WatchList · Current