Above the Green Line -01
  • Market Insights
        • Commentary
          • Daily
          • Weekly
        • BUY / SELL SIGNALS
          • Trade Posts
          • Recent Trade Alerts
          • Recent Day Trades
        • BLOGROLL
          • Dividend Growth Blog
          • ETF Sector Blog
          • Dow Dogs
          • TPOW Blog
  • Strategies
        • SWING TRADING
          • Current Positions
          • Watchlists
          • Closed Positions
          • Candidates - TOP 100
          • Specialty Stocks
        • WEEKLY STOCK PICK
          • TPOW Charts
          • TPOW Performance
          • TPOW Strategy Guide
          • TPOW Performance Dashboard
          • Why Weekly Trading Works
        • DAY TRADING
          • Watch List
        • ATGL DASHBOARD
        • ETF STRATEGIES
          • ETF Sector Rotation
          • ETF Sector Portfolio
        • DIVIDEND GROWTH
          • Dividend Growth Portfolio
          • Dividend Calendar
        • DOGS OF THE DOW
          • Dogs of the Dow Portfolio
          • DOW 5 Portfolio
  • Markets
        • US MARKET
          • Commodities
          • Energy
          • Precious Metals
          • Volatility
        • GLOBAL MARKETS
          • Market Indices
          • Economic Calendar
          • FOREX Heat Map
          • FOREX Cross Rates
          • Crypto Currency Market
  • Investing
    • Discord Community
    • Dashboard
  • Resources
        • INVESTING GUIDES
          • Dividend Growth Guide
          • Investment Strategy Framework
          • ETF Investing Handbook
          • Stock Trading Handbook
        • ARTICLES
          • Dividend Growth Model Articles
          • ETF Articles
          • Investment Strategies Articles
          • Market and Economic Insights
          • Stock Trade Articles
          • Stock Reviews
        • TOOLS
          • Stock Scanners
          • Charting Software
          • Brokerage Firms
          • Stocks We Review
        • STOCK CHARTS
          • Key Components
          • Reading Charts
          • Drawing Stock Charts
          • Identifying Trends
  • About
    • Contact Us
    • How to Win
    • #1 At Stockcharts
    • Disclaimer
    • FAQ
  • Log In
  • Subscribe

September 7, 2017

Money Wave Alert! Sep 7, 2017

XLF Chart

  Stubborn Markets!   Markets are mixed today, as the Tech Stocks are up on the weak US Dollar, and the Financials are dumping. The Leaders are still above their Pink Lines (10-day avgs.)   WAIT for Green Zone Buys. The Tech Fund and … [Read more...]

September 6, 2017

Money Wave Alert! Sep 6, 2017

XBI Chart

  Markets are up slightly today, as the Leaders held above their Pink Lines (10-day avgs.) The BioTech Fund is the strongest, and should be good for a trade next time in the Green Zone. Most Leading Funds were in the Red Zones (probably … [Read more...]

September 5, 2017

Money Wave Alert! Sep 5, 2017

  StockCharts.com is DOWN today, so "real time" Charts might not be available. Markets are down today, as most Funds were in the Red Zones (probably too late to Buy for the Short Term). Nimble Traders should be raising Cash and WAITING for … [Read more...]

September 3, 2017

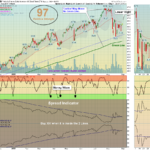
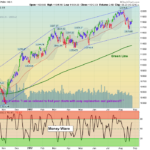
Green Line Weekly, Sep 3, 2017

NYA Chart

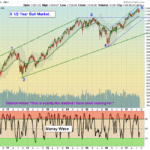
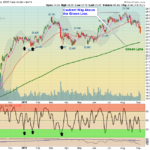
  09/03/2017:  Markets were up again this week, as the major Indices are re-testing the early August Highs. Since the Trump Election in November, the Market Indices have been able to continuously make Higher Highs. Eventually the Indices will … [Read more...]

September 1, 2017

Money Wave Alert! Sep 1, 2017

SPX Chart

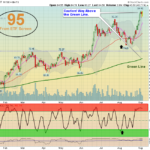
  Markets are Closed on Monday Sep 4th to celebrate Labor Day holiday. Markets are higher again today, and the Tech Fund and BioTech Fund have been able to make New Highs again. Caution! Most Funds are in the Red Zones (probably too … [Read more...]

August 31, 2017

Money Wave Alert! Aug 31, 2017

  Markets are higher again today, and the Tech Fund and BioTech Fund have been able to make New Highs. The DOW Index and most other Indices are going back up to re-test the early August Highs. They should make New Highs soon, for this rally … [Read more...]

August 30, 2017

Money Wave Alert! Aug 30, 2017

TNX Chart

Markets are creeping higher today, as the strongest Leaders are going back up to re-test the recent the early August Highs. Volume is low on most Investments. The Leading DOW Index, and the Tech Fund must make New Highs soon, for this rally to … [Read more...]

August 29, 2017

Money Wave Alert! Aug 29, 2017

DIA Chart

  Markets dumped this morning and rallied back strong. The strongest Leaders won't go down much, as buyers are still coming in on dips. The Leading DOW Index, and the Tech Fund must make New Highs soon, for this rally to … [Read more...]

August 28, 2017

Money Wave Alert! Aug 28, 2017

AAPL Chart

  Markets are mixed today, as Oil Prices dropped. The strongest Leaders won't go down much, but 35% of the S&P 500 stocks are Below their 200-day average (Bearish). The Leading DOW Index, and the Tech Fund must make New Highs soon, … [Read more...]

August 26, 2017

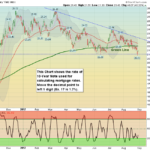
Green Line Weekly Aug 26, 2017

NYA Chart

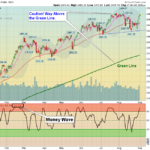
  08/26/2017:  Markets were up this week, after 2 weeks of selling finally dried up. The Small Caps corrected down near the Green Line and became very over-sold, but the Strongest DOW and TECH Indices have not corrected enough yet for decent … [Read more...]

  • « Previous Page
  • 1
  • …
  • 516
  • 517
  • 518
  • 519
  • 520
  • …
  • 559
  • Next Page »

Subscribe to Our Newsletter

AGL Logo

Get our eBook Now!

Candlestick - A Swing Traders Friend

We don’t spam! Read our privacy policy for more info.

You’ve been successfully subscribed to our newsletter!

Voted #1 at Stock Charts

SH Chart
Inverse S&P 500 Fund (SH) will have a Money Wave Buy today.

Help Us Help Animals

Help Us Help Animals

Recent Comments

  • ATGL Weekly Money Flow - 2026-02-08 on ATGL Top Pick of the Week! Jan 25, 2026
  • ATGL Weekly Money Flow - 2026-01-25 on ATGL Top Pick of the Week! Jan 11, 2026
  • ATGL Weekly Money Flow - 2025-12-28 on ATGL Top Pick of the Week Dec 21, 2025
  • Inside Bar Trading Strategy: Improve Timing and Wins on Price Action Trading: Mastering the Art of Reading the Market Without Indicators
  • Breakaway Gap Explained: Identify High-Probability Setups on Identifying Market Exhaustion Signals for Smarter Trading Decisions

Become a Green Liner!

Help me make more Money in the Stock Market.

ON ATGL

  • DashBoard
  • Weekly Commentary
  • Daily Buy / Sell Signals
  • Day Trade Setup
  • Trading Rooms

Design & Develop By Pixelvect

STRATEGIES

  • Swing Trading
  • ATGL Pick of the Week
  • Dividend Growth
  • ETF Sector Rotation
  • Dogs of the Dow

HELP

  • ATGL Trading Rules
  • FAQ
  • Account Maintenance
  • Contact US
  • Join

FOLLOW US

Instagram Linkedin Twitter Facebook

© COPYRIGHT 2024 · ABOVETHEGREENLINE.COM · ALL RIGHTS RESERVED · PRIVACY · TERMS · CONTACT · WATCHLIST · CURRENT