
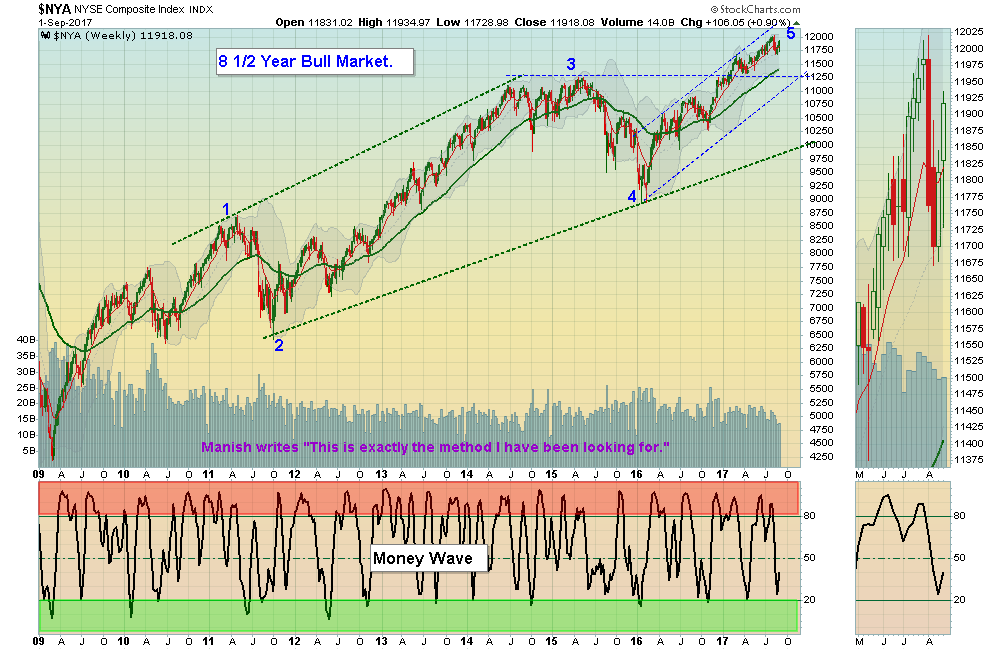
09/03/2017: Markets were up again this week, as the major Indices are re-testing the early August Highs. Since the Trump Election in November, the Market Indices have been able to continuously make Higher Highs. Eventually the Indices will not be able to make Higher Highs, as Buyers run out of Money. Then you will normally see a “Double Top” or possible “M” pattern, and nimble investors will EXIT, and attempt to Buy again lower (maybe down near the Green Line like the Small Caps went down to two weeks ago).
Green Line bounces can be good, as the Small Caps bounced 2.66% this week, compared to 1.34% bounce on the S&P 500 Index. The TECH and BioTech Indices were able to make new Highs this week, but only 1 (Apple) of the 5 FAANG Stocks have made new Highs recently (internal weakness). Failure of the major Indices to make New Highs soon could cause them to have a bigger correction, where they could slip below the Red Lines (50-day avgs.)
The stronger Commodities like Copper and Coal also made New Highs, but the Volume has not been good, and they are Way Above the Green Line.
Crude Oil was down for the week, and the US Dollar had a small bounce off New Lows.
MONEY WAVE BUYS SOON: We are currently in 1 logged Open Positions, and there is 1 Investment on the Short Term Watch List.
LONG TERM TRADES
The Funds below are currently out of favor, but historically could possibly Double or more from these lower levels. We are looking for a good Entry Point for these, but need the entire Economy & Inflation to pick up speed:
BITA BITA HOLDINGS Wait for Green Zone on the Weekly Chart.
DBC COMMODITY FUND Waiting for Break Out Above $16.08.
JJC COPPER FUND Back in Red Zone, but Relative Strength finally got up to 90.
KOL COAL FUND Wait for Green Zone on Daily Chart.
LL LUMBER LIQUIDATORS Wait for Green Zone on Daily Chart.
UGA US GASOLINE FUND Waiting on Break Out Above $32.03.
VALE VALE DE RIO Break Out Above $11.39 on High Volume.
Click for Portfolio (Open Positions)
Click for Watch List
Click for Closed Positions
Alert! Market Risk is Medium (Yellow Zone). The probability of successful Short Term Trades is lower, when the S&P 500 is Way Above the Green Line. Even the Strongest Funds can get chopped up. Either take quick gains from Money Wave Pops, or STAY IN CASH & WAIT for a larger correction.
[s_static_display]
Our friend Suzie has created THE ULTIMATE GUIDE TO PET ADOPTION
QUESTION: Doug writes: “I am considering your service and am curious as to the difference in RSf numbers and RS ranking from investors.com. Is it a weighting difference in the near term quarter or something else altogether?”
ANSWER: Hi Doug, we prefer to use Relative Strength from IBD (Investor’s Business Daily) or www.etfscreen.com, as they use more of a weighted 1 year RS.
SCTR (StockCharts Technical Rank) is more convenient, but is weighted too fast to the last 90 days of trading…
Good trading, and tell your friends!


