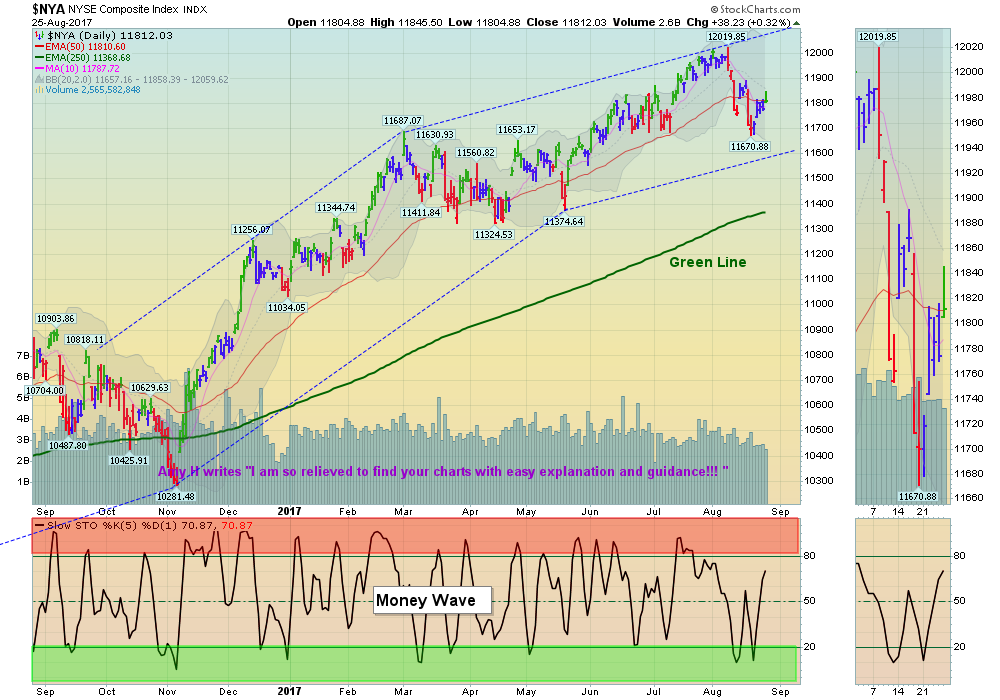
08/26/2017: Markets were up this week, after 2 weeks of selling finally dried up. The Small Caps corrected down near the Green Line and became very over-sold, but the Strongest DOW and TECH Indices have not corrected enough yet for decent advances. Failure of these 2 Indices to make New Highs soon could cause them to have a bigger correction, where they could slip below the Red Lines (50-day avgs.)
The stronger Commodities like Copper and Coal are firming up with the weak US Dollar.
Crude Oil was up for the week, and the US Dollar is back down on the New Lows.
MONEY WAVE BUYS SOON: We are currently in 2 logged Open Positions, and there are 2 Investments on the Short Term Watch List.
Check out the new format of the Watch List, Portfolio & Closed Positions… Now with 2 Charts on many Investments.
LONG TERM TRADES
The Funds below are currently out of favor, but historically could possibly Double or more from these lower levels. We are looking for a good Entry Point for these, but need the entire Economy & Inflation to pick up speed:
We bought IPI INTREPID POTASH this week for the Long Term Portfolio… Target is $10.
BITA BITA HOLDINGS Wait for Green Zone on Daily Chart.
DBC COMMODITY FUND Waiting for Break Out Above $16.08.
JJC COPPER FUND Back in Red Zone, but Relative Strength finally got up to 90.
KOL COAL FUND Wait for Green Zone on Daily Chart.
LL LUMBER LIQUIDATORS Wait for Green Zone on Daily Chart.
UGA US GASOLINE FUND Waiting on Break Out Above $32.03.
VALE VALE DE RIO Break Out Above $11.39 on High Volume.
Click for Portfolio (Open Positions)
Click for Watch List
Click for Closed Positions
Alert! Market Risk is Medium (Yellow Zone). The probability of successful Short Term Trades is lower, when the S&P 500 is Way Above the Green Line. Even the Strongest Funds can get chopped up. Either take quick gains from Money Wave Pops, or STAY IN CASH & WAIT for a larger correction.
[s_static_display]
Tell your Friend about us, and HELP ANIMALS.
QUESTION: Gian writes “Hi, I have some problem in defining the position for a trade like IPI. Suppose I have $50K and as you suggest I split in five positions. That means I have 10K to invest in IPI and I should buy 10.000 / 3,32 = 3,012 shares.
Suppose that the trade goes wrong and I take the full loss at the stop. That means that I will have a loss of (2,41-3,32) x 3.012 = – $2.770 or 6% of the initial portfolio. Does it make sense?
Thanks, Gian.”
ANSWER: That is a great question Gian. Yes a Long Term Investment needs plenty of slack to fluctuate when coming off the bottom…
If IPI does not go broke, it could possibly return to 50 or 100 % of the previous High of $40.22… That means somebody paid $121,143 for the 3012 shares that you are considering buying for $10,000.
You might not want to risk a 28% loss to the Green Line on $10,000. Another way to look at it is Reward / Risk. It is possible that IPI could return to $20 or higher over several years (or $16.68 gain).
It could also go down and you could lose $0.92 if it Closed below the Green Line. So your possible Reward / Risk could be $16.68 / $0.92 or 18 : 1 !!! Not many Investments offer that potential, ever…
You might want to Buy less than $10,000 IPI, if you don’t want the downside potential, but then you could miss a HOME RUN.
IPI Chart
