Above the Green Line -01
  • Market Insights
        • Commentary
          • Daily
          • Weekly
        • BUY / SELL SIGNALS
          • Trade Posts
          • Recent Trade Alerts
          • Recent Day Trades
        • BLOGROLL
          • Dividend Growth Blog
          • ETF Sector Blog
          • Dow Dogs
          • TPOW Blog
  • Strategies
        • SWING TRADING
          • Current Positions
          • Watchlists
          • Closed Positions
          • Candidates - TOP 100
          • Specialty Stocks
        • WEEKLY STOCK PICK
          • TPOW Charts
          • TPOW Performance
          • TPOW Strategy Guide
          • TPOW Performance Dashboard
          • Why Weekly Trading Works
        • DAY TRADING
          • Watch List
        • ATGL DASHBOARD
        • ETF STRATEGIES
          • ETF Sector Rotation
          • ETF Sector Portfolio
        • DIVIDEND GROWTH
          • Dividend Growth Portfolio
          • Dividend Calendar
        • DOGS OF THE DOW
          • Dogs of the Dow Portfolio
          • DOW 5 Portfolio
  • Markets
        • US MARKET
          • Commodities
          • Energy
          • Precious Metals
          • Volatility
        • GLOBAL MARKETS
          • Market Indices
          • Economic Calendar
          • FOREX Heat Map
          • FOREX Cross Rates
          • Crypto Currency Market
  • Investing
    • Discord Community
    • Dashboard
  • Resources
        • ARTICLES
          • Dividend Growth Model Articles
          • ETF Articles
          • Investment Strategies Articles
          • Market and Economic Insights
          • Stock Trade Articles
          • Stock Reviews
        • TOOLS
          • Stock Scanners
          • Charting Software
          • Brokerage Firms
          • Stocks We Review
        • STOCK CHARTS
          • Key Components
          • Reading Charts
          • Drawing Stock Charts
          • Identifying Trends
        • RETIREMENT PLANNING
  • About
    • Contact Us
    • How to Win
    • #1 At Stockcharts
    • Disclaimer
    • FAQ
  • Log In
  • Subscribe

August 24, 2018

Money Wave Alert! Aug 24, 2018

SPC Chart

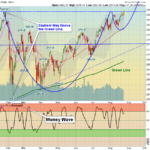
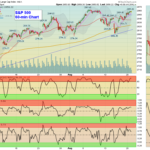
  Markets were higher today as the S&P 500, NASDAQ, and Small Cap Indices made New Highs on lower Volume. So far the Break Outs have  not decisively pushed up thru the January Highs. Very few individual stocks are making New Highs. … [Read more...]

August 23, 2018

Money Wave Alert! Aug 23, 2018

XLK Chart

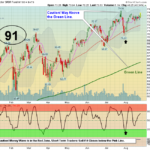
  More summer doldrums.  Markets were mixed again today as the S&P 500 has stalled up near the January Highs, which is normal. Failing to make New Highs soon would be not be "Bullish". The DOW Transport Index made new Highs, but the … [Read more...]

August 22, 2018

Money Wave Alert! Aug 22, 2018

Emotions Chart

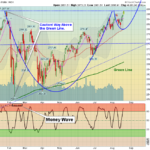
  Markets were mixed today as the S&P 500 has stalled up near the January Highs, which is normal. Failing to make New Highs soon would be not be "Bullish", and the Volume has not been higher like it should be for a Break Out to higher … [Read more...]

August 21, 2018

Money Wave Alert! Aug 21, 2018

SPX Chart

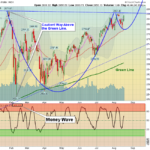
  Markets were up again today and the S&P 500 was able to make it back up to the January Highs. It would be much more "Bullish" if the Volume was high. The S&P 500 is at Resistance. If you are nervous and have some profits, and you … [Read more...]

August 20, 2018

Money Wave Alert! Aug 20, 2018

SPX 60-min

  Markets were up again today on low Volume. The DOW Index is trying to catch up with the others Indices, and the Techs have been weaker. The Markets are not pulling back enough for decent Money Wave trades, as emotional Investor's Greed … [Read more...]

August 19, 2018

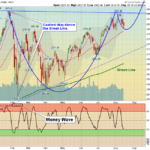
Weekly Green Line Aug 19, 2018

SPX Chart

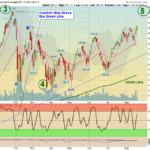
  08/19/2018:  Markets were  up slightly for the week, after the Indices dipped down near the Red Lines (50-day avgs.) and then bounced. Now the Indices need to Close above the January Highs for the rally to remain healthy. A "Bullish" … [Read more...]

August 17, 2018

Money Wave Alert! Aug 17, 2018

DIA Chart

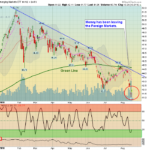
The DOW Index is still trying to get back up to the Jan Highs.  Problems today with StockChart's Charts... Markets were up again today on very narrow Buying. The DOW Index is trying to catch up with the others Indices, as it is still about … [Read more...]

August 16, 2018

Money Wave Alert! Aug 16, 2018

EEM Chart

  Markets  "Gapped Up" today on good news, and the Indices hopped back above their Pink Lines (10-day avgs.)  The Markets are not pulling back enough for decent Money Wave trades, as emotional Investors FEEL TOO GOOD, and don't have the … [Read more...]

August 15, 2018

Money Wave Alert! Aug 15, 2018

SPX Chart

  Markets  were down today as the Indices slipped below their Pink Lines (10-day avgs.) to create Short Term Sell Signals. Please be patient and WAIT for the Leaders and Indices to return to their Green Zones for Money Wave Buy … [Read more...]

August 14, 2018

Money Wave Alert! Aug 14, 2018

GDX Chart

  Markets  were higher today as the Leaders are bouncing up off their Pink Lines (10-day avgs.) to avoid Short Term Sell Signals. Indices like QQQ (Nasdaq 100) XLK (Tech Fund) and FDN (Internet Fund) need to make New Highs soon for the … [Read more...]

  • « Previous Page
  • 1
  • …
  • 487
  • 488
  • 489
  • 490
  • 491
  • …
  • 559
  • Next Page »

Subscribe to Our Newsletter

AGL Logo

Get our eBook Now!

Candlestick - A Swing Traders Friend

We don’t spam! Read our privacy policy for more info.

You’ve been successfully subscribed to our newsletter!

Voted #1 at Stock Charts

SH Chart
Inverse S&P 500 Fund (SH) will have a Money Wave Buy today.

Help Us Help Animals

Help Us Help Animals

Recent Comments

  • ATGL Weekly Money Flow - 2026-02-08 on ATGL Top Pick of the Week! Jan 25, 2026
  • ATGL Weekly Money Flow - 2026-01-25 on ATGL Top Pick of the Week! Jan 11, 2026
  • ATGL Weekly Money Flow - 2025-12-28 on ATGL Top Pick of the Week Dec 21, 2025
  • Inside Bar Trading Strategy: Improve Timing and Wins on Price Action Trading: Mastering the Art of Reading the Market Without Indicators
  • Breakaway Gap Explained: Identify High-Probability Setups on Identifying Market Exhaustion Signals for Smarter Trading Decisions

Become a Green Liner!

Help me make more Money in the Stock Market.

ON ATGL

  • DashBoard
  • Weekly Commentary
  • Daily Buy / Sell Signals
  • Day Trade Setup
  • Trading Rooms

Design & Develop By Pixelvect

STRATEGIES

  • Swing Trading
  • ATGL Pick of the Week
  • Dividend Growth
  • ETF Sector Rotation
  • Dogs of the Dow

HELP

  • ATGL Trading Rules
  • FAQ
  • Account Maintenance
  • Contact US
  • Join

FOLLOW US

Instagram Linkedin Twitter Facebook

© COPYRIGHT 2024 · ABOVETHEGREENLINE.COM · ALL RIGHTS RESERVED · PRIVACY · TERMS · CONTACT · WATCHLIST · CURRENT