
By ATGL
Updated April 4, 2025
The inverse head and shoulders pattern is among the most reliable trading patterns you should know for spotting potential market reversals. Unlike bearish formations such as the bear flag pattern or bear pennant pattern, this pattern signals a possible upward price movement after a downtrend. Professional traders and technical analysts value this pattern for its clear structure and relatively high success rate when properly identified. This article explores the inverse head and shoulders pattern, how to identify its breakout, and strategies for trading it effectively.
What Is the Inverse Head and Shoulders Pattern?
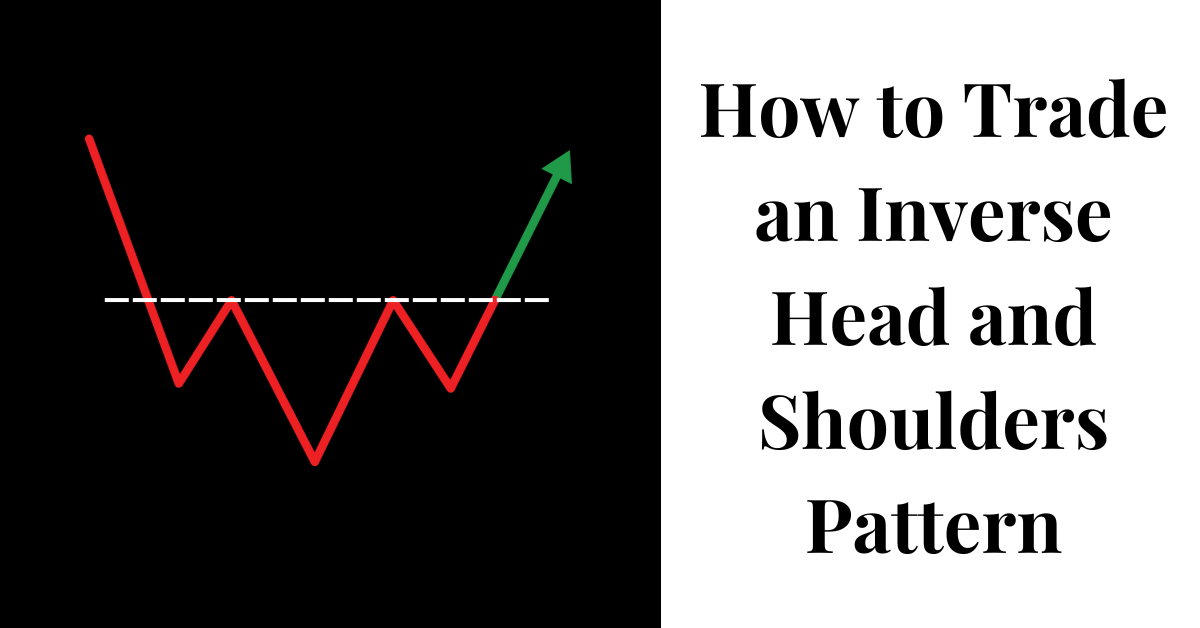
The inverse head and shoulders pattern, also known as the reverse head and shoulders, is a bullish reversal formation that typically appears at the end of a downtrend. Unlike its bearish counterpart, the head and shoulders pattern, this formation signals a potential upward price movement. The pattern consists of three consecutive troughs, with the middle trough (the head) being deeper than the two outer troughs (the shoulders), all connected by a neckline that acts as a resistance level.
This technical pattern gains significance because it demonstrates a gradual shift in market sentiment from bearish to bullish. As the pattern completes, it suggests that selling pressure is diminishing while buying pressure is increasing, potentially leading to a sustained upward movement once the neckline resistance is broken.
Components of the Inverse Head and Shoulders Pattern
Understanding the key components of this pattern helps you identify it accurately.
The left shoulder forms during a downtrend when the price declines to a new low and then rallies. This initial trough represents the first point where selling pressure temporarily subsides.
The head follows the left shoulder when the price drops to an even lower point than the left shoulder before rallying again. This deeper trough indicates the final stage of strong selling pressure.
The right shoulder develops when the price declines again but doesn’t reach the depth of the head before rising. This higher low suggests diminishing selling pressure.
The neckline acts as the resistance level, connecting the highs formed after the left shoulder and the head. The neckline may slope upward, downward, or remain horizontal, depending on market conditions.
Unlike symmetrical formations such as the triangle chart pattern, the inverse head and shoulders doesn’t require perfect symmetry between shoulders. What matters most is the relationship between the three troughs and the neckline.
How To Identify the Inverse Head and Shoulders Pattern Breakout
Identifying an inverse head and shoulders pattern breakout requires careful analysis of price action and confirmation signals. The most critical point occurs when the price breaks above the neckline after forming the right shoulder. This breakout signals the potential start of a new uptrend.
To identify a valid breakout:
- Confirm the pattern has fully formed with a clear left shoulder, head, right shoulder, and neckline.
- Watch for the price to close decisively above the neckline, preferably with increased trading volume.
- Look for the breakout candle to show strong bullish characteristics, such as a large body with little to no upper shadow.
- Monitor for a retest of the neckline from above, which often occurs after the initial breakout and provides additional confirmation when the price bounces from this new support level.
Unlike patterns such as the cup and handle pattern or bull flag pattern, which form during established uptrends, the inverse head and shoulders typically appears at the end of downtrends, making its breakout particularly significant as a trend reversal signal.
Trading the Inverse Head and Shoulders Pattern
Effectively trading this pattern requires strategic entries, precise exit points, and sound risk management.
- Use volume in trading: Volume should ideally decrease during the formation of the pattern and increase significantly during the breakout above the neckline. This volume confirmation strengthens the reliability of the pattern.
- Calculate risk-reward ratios: Before entering a trade, calculate the potential reward against the risk. A common approach sets the stop loss below the right shoulder, with the profit target calculated by measuring the distance from the head to the neckline and projecting that distance upward from the breakout point.
- Wait for the neckline breakout: The safest entry point occurs after the price breaks and closes above the neckline. Some traders prefer to wait for a retest of the neckline to confirm it as new support before entering.
- Establish profit targets: While the measured move (head to neckline distance) provides an initial target, consider adjusting this based on other technical factors such as previous resistance levels or Fibonacci extensions.
Unlike patterns such as the rising wedge pattern or triple top pattern, which focus on the continuation or reversal of existing trends, the inverse head and shoulders specifically signals the potential end of a downtrend and the beginning of an uptrend.
Common Mistakes in Trading With the Inverse Head and Shoulders Pattern
Even experienced traders make errors when trading this pattern:
- Identifying the pattern too early before the right shoulder has fully formed.
- Ignoring volume confirmation, which can lead to trading false breakouts.
- Setting stop losses too tight, not accounting for normal price volatility near the neckline.
- Failing to adjust trading strategies for different market contexts and timeframes.
- Overlooking other technical indicators that might contradict the pattern’s signals.
Unlike simpler patterns such as the double bottom pattern, the inverse head and shoulders requires more time to develop fully, demanding patience from traders waiting for confirmation.
FAQs About the Inverse Head and Shoulders Pattern
How Do You Confirm an Inverse Head and Shoulders Pattern?
Confirmation occurs when the price breaks above the neckline with increased volume after forming all three components. The subsequent retest of the neckline as support provides additional confirmation.
How Accurate Is the Inverse Head and Shoulders Pattern?
Research suggests this pattern has a success rate of approximately 65-75% when properly identified and traded with appropriate confirmation. However, accuracy varies based on market conditions, timeframe, and confirmation techniques.
What Is the Entry Point of the Inverted Head and Shoulders Pattern?
The ideal entry point is after the price breaks and closes above the neckline, with additional confirmation from volume increase and possibly a successful retest of the neckline as support.
Can This Pattern Be Applied to All Markets?
Yes, the inverse head and shoulders pattern appears across various markets, including stocks, forex, cryptocurrencies, and commodities, though its reliability may vary between different market types and conditions.
Making the Most of the Inverse Head and Shoulders Pattern With Above the Green Line
Trading the inverse head and shoulders pattern successfully requires not only technical knowledge but also disciplined execution and continuous learning. Professional traders understand that pattern recognition is just one aspect of a comprehensive trading strategy.
Above the Green Line provides you with powerful tools and resources to enhance pattern recognition skills and develop effective trading strategies. Our premium membership offers access to expert analysis, real-time pattern alerts, and educational resources that help you maximize your success with technical patterns like the inverse head and shoulders.
Take your technical analysis skills to the next level by joining our community of dedicated traders at Above the Green Line memberships today.

Related Articles

Margin Call Explained: What Triggers It and How to Avoid One

AMC Short Squeeze Explained: Timeline, Causes, and Trading Risks

Volatility Clustering in Financial Markets: Understand Why It Happens

Chaikin Money Flow (CMF): How to Use Volume to Spot Real Market Strength
