By ATGL
Updated February 18, 2024
Understanding the principles of Internal Rate of Return (IRR) and Net Present Value (NPV) is pivotal in financial analysis and decision-making. These two metrics serve as compasses guiding investors, managers, and analysts through the complex terrain of project evaluation. IRR represents the annualized rate of return that a project is expected to generate, while NPV calculates the present value of all cash flows associated with a project. In this article, we delve into the intricacies of IRR versus NPV, unraveling their definitions, calculations, applications, and the nuanced considerations that shape their interpretations in the realm of finance and investment.
Internal Rate of Return (IRR) Defined
The Internal Rate of Return (IRR) is a crucial financial metric used to evaluate the profitability of an investment or project over a period of time. It is the annualized rate of return that makes the net present value (NPV) of all the cash flows from the investment equal to zero or stated another way, it is the discount rate at which the net present value of all cash flows associated with the investment equals zero. In simpler terms, IRR is the annualized rate of return that an investment is expected to generate over its lifespan. This metric is significant because it helps investors assess the attractiveness of a potential investment by comparing the expected return with the cost of capital or other available investment opportunities. A higher IRR indicates a more favorable investment opportunity, while a lower IRR suggests lower profitability or higher risk.
IRR Formula and Calculation Examples
The formula for calculating the Internal Rate of Return (IRR) involves finding the discount rate that makes the net present value (NPV) of all cash flows from an investment equal to zero. Mathematically, it can be expressed as the discount rate (r) for which the sum of the present values of all cash inflows (CFi) equals the initial investment (CF0), as follows:
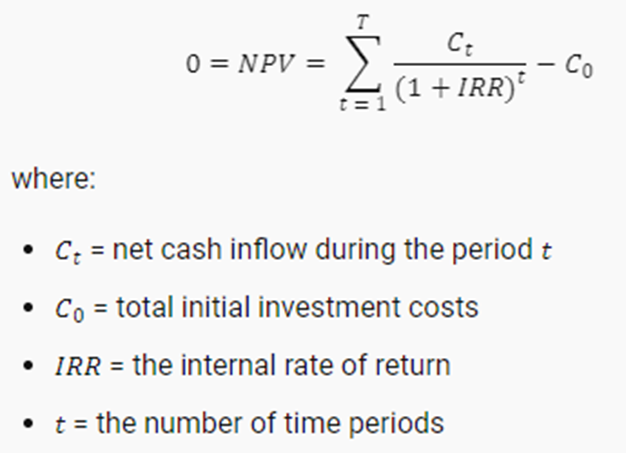
This equation is typically solved iteratively using numerical methods, such as trial and error or specialized software. As an example, consider a project with an initial investment of $10,000, expected cash flows of $3,000 in year 1, $4,000 in year 2, and $5,000 in year 3. By applying the IRR formula, we determine that the project’s IRR is approximately 15.5%. This means that the project is expected to yield an annualized return of 15.5% over its duration, making it a potentially attractive investment opportunity.
Advantages and Limitations of the IRR
The Internal Rate of Return (IRR) metric offers several advantages in investment analysis. One of the key advantages of IRR is its ability to provide a single percentage rate that summarizes the profitability of an investment, making it easier for investors to compare different projects or investment opportunities. Additionally, IRR considers the timing of cash flows, which is crucial in assessing the value of an investment over time. Moreover, IRR reflects the opportunity cost of capital, enabling investors to evaluate whether the expected return of an investment exceeds its cost. Positive cash flows contribute to increasing the IRR as they indicate returns on an investment. A negative IRR typically happens when there are significant upfront costs or when the project’s has negative cash flow for an extended period before turning positive. The IRR also has limitations. It may lead to incorrect investment decisions in cases of non-conventional cash flow patterns or mutually exclusive projects. Furthermore, IRR does not consider the size of the investment, leading to potential biases favoring smaller projects with higher IRRs over larger or long-term projects with lower IRRs. Additionally, IRR assumes reinvestment at the calculated rate, which may not always be feasible or realistic. Therefore, while IRR provides valuable insights, it should be used alongside other metrics and qualitative factors to make well-informed investment decisions.
Net Present Value (NPV) Defined
Active management Net Present Value (NPV) is a fundamental financial metric used to evaluate the profitability of an investment or project. It measures the difference between the present value of cash inflows and outflows associated with the investment, discounted at a specified rate, typically the cost of capital. NPV considers the time value of money, reflecting that a dollar received in the future is worth less than a dollar received today. A positive NPV indicates that the present value of cash inflows exceeds the present value of cash outflows, suggesting that the investment is expected to generate value and is potentially profitable. Conversely, a negative NPV suggests that the project is not expected to generate sufficient returns to cover its costs. Therefore, NPV serves as a crucial tool for decision-making, guiding investors, managers, and analysts in assessing the financial viability and desirability of investment opportunities.
NPV Formula and Calculation Examples
The formula for calculating Net Present Value NPV of an investment involves discounting all cash inflows and outflows associated with an investment back to their present values and then subtracting the initial investment over n time periods. Mathematically, the NPV equation can be expressed as:
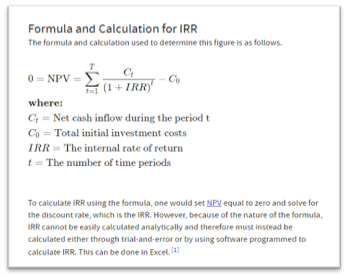
For example, consider a project with an initial investment of $10,000, expected cash flows of $3,000 in year 1, $4,000 in year 2, and $5,000 in year 3. Assuming a discount rate of 10%, we can calculate the NPV as follows:
= 3000(1+0.10)^1 + 4000(1+0.10)^2 + 5000(1+0.10)^3 −10000
= 3000(1.10) + 4000(1.10)^2 + 5000(1.10)^3 − 10000
= 2727.27 + 3305.79 + 3751.32 − 10000
= 6784.38 − 10000
=−3215.62
In this example, the NPV is negative, indicating that the project’s expected returns are insufficient to cover its costs at the given discount rate.
Benefits and Challenges of the NPV
The Net Present Value method offers several benefits in investment appraisal and decision-making processes. One of its primary advantages is its ability to incorporate the time value of money, providing a more accurate assessment of the profitability of an investment by discounting future cash flows back to their present value. NPV also considers the risk associated with future cash flows by utilizing a specified discount rate, often the cost of capital or the required rate of return, allowing investors to account for the opportunity cost of capital. Furthermore, NPV facilitates comparisons between different investment alternatives by providing a single metric that quantifies the value added by each option. However, NPV comes with its challenges. Estimating future cash flows and determining an appropriate discount rate can be subjective and uncertain, potentially leading to inaccurate NPV calculations. Moreover, NPV does not consider the size or scale of an investment, which may favor smaller projects with higher NPVs over larger ones with lower NPVs. Additionally, NPV may not capture intangible benefits or costs, such as strategic advantages or environmental impacts, which could influence investment decisions. Despite these challenges, NPV remains a valuable tool for evaluating investment opportunities and guiding resource allocation decisions in various industries.
IRR vs NPV: Which One To Use for Potential Investment Analysis
When deciding between Internal Rate of Return (IRR) and Net Present Value (NPV) for potential investment analysis, it’s essential to understand the strengths and limitations of each metric. IRR offers a single percentage figure that summarizes the annual rate of return of an investment, making it intuitive for comparing different projects or investment opportunities. However, IRR may lead to misleading conclusions in certain scenarios, such as non-conventional cash flow patterns or mutually exclusive projects. On the other hand, NPV provides a comprehensive measure of the absolute value added by an investment, considering the time value of money and the opportunity cost of capital. While NPV facilitates straightforward comparisons between investment alternatives, it requires a specified discount rate and accurate estimation of future cash flows, which can be challenging. In practice, both IRR and NPV are valuable tools for investment analysis, and the choice between them depends on the specific context and preferences of investors. For projects with conventional cash flow patterns and mutually exclusive alternatives, NPV is often favored for its robustness and clarity. Conversely, IRR may be preferred when evaluating projects with similar scale and duration, focusing on the relative attractiveness of investment opportunities. Ultimately, incorporating both metrics and considering qualitative factors can enhance the decision-making process and lead to more informed investment decisions.
Ensure Your Investment Decisions Yield the Desired Return
Understanding NPV or IRR provide valuable insights into the profitability and feasibility of investment opportunities. Developing a successful trading plan is pivotal for achieving investment goals and navigating market complexities. Central to this endeavor is leveraging a wide range of resources that facilitate well-informed decision-making and strategic preparation. These resources span from educational materials and market analysis to advanced trading tools and community forums.
At Above the Green Line, we are committed to providing investors with the tools and insights necessary to develop effective trading strategies. Our platform offers a wealth of information, including proprietary metrics and analyses, designed to support investors at all levels.
Whether you’re a seasoned investor or just starting, companies like Above the Green Line can significantly enhance your chances of success in achieving your investment objectives. Elevate your trading strategy today by exploring the resources available through Above the Green Line, and discover how our memberships can enhance your investment approach and contribute to your trading success.


