
By ATGL
Updated July 31, 2025
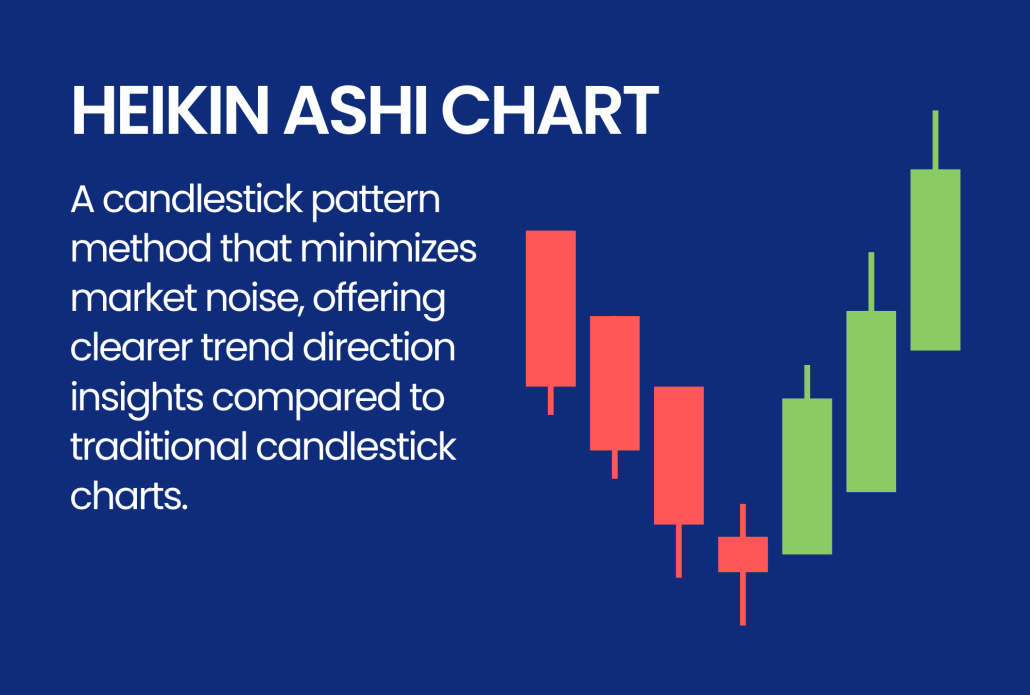
Imagine a trading world where market noise fades into the background, and trends stand out with stark clarity. Heikin Ashi, a lesser-known yet powerful charting method, offers traders this advantage by smoothing price action. Unlike traditional candlesticks, Heikin Ashi provides a unique way to visualize market trends, making it an invaluable tool for those seeking better methods for identifying trends in trading.
Though not as widely used as some charting techniques, Heikin Ashi is gaining popularity for its ability to reduce market noise and reveal clearer directional moves. This article explores how Heikin Ashi candles are constructed, their benefits, and how they can enhance your trading strategies. Whether you’re optimizing your approach or discovering Heikin Ashi for the first time, these insights will help you trade smarter.
How Heikin Ashi Candles Are Constructed
Heikin Ashi charts offer a smoothed view of price action compared to traditional candlestick patterns. While standard candlestick charts use raw open, high, low, and close (OHLC) data, Heikin Ashi relies on averaged values to reduce market noise.
Formulas for Heikin Ashi:
- Close = (Open + High + Low + Close) / 4
- Open = (Previous Open + Previous Close) / 2
- High = Max(High, Heikin Ashi Open, Heikin Ashi Close)
- Low = Min(Low, Heikin Ashi Open, Heikin Ashi Close)
These calculations generate smoother candles that reflect overall market sentiment and trend direction more clearly.
Comparison Table: Standard Candlesticks vs. Heikin Ashi
| Aspect | Standard Candlesticks | Heikin Ashi |
|---|---|---|
| Data Used | Actual OHLC values | Averaged values |
| Noise Level | High | Low |
| Trend Identification | Inconsistent | Smoother and clearer |
FAQ: What is the Heikin Ashi 5 Rule?
The “5 Rule” states that five consecutive opposite-colored Heikin Ashi candles can signal a potential trend reversal. This rule is particularly useful for swing traders and those looking to spot high-probability day trading patterns.
Key Benefits of the Heikin Ashi Trading Strategy
Heikin Ashi simplifies price action, making it easier to identify trends and stay in profitable trades longer. It’s an effective addition to a variety of investment strategies.
Why Use Heikin Ashi?
- Smoother Trends: Helps you stay in trades longer by avoiding whipsaws.
- Reduced Noise: Filters out short-term fluctuations that can mislead decisions.
- Clear Signals: Trends and reversals are easier to identify visually.
Ideal Use Cases:
- Sideways Markets: Reduces false entries.
- Strong Trends: Helps ride longer price movements.
Is Heikin Ashi Profitable?
Yes, especially when paired with complementary tools like moving averages or RSI. Practice and backtesting are essential to adapt this charting method to your specific trading strategies.
Spotting Trends with Heikin Ashi Charts
Heikin Ashi charts are designed to make trend analysis more intuitive. By reducing minor fluctuations, they provide a clearer view for identifying trends in trading. These charts visually highlight the market’s strength and direction, making them ideal for entry and exit planning.
How to Identify Trend Weakness and Reversals
Heikin Ashi candles reveal market sentiment through color and shape. A series of green (bullish) candles without lower wicks signals a strong uptrend, while red (bearish) candles without upper wicks indicate strong selling.
Watch for These Signals:
- Doji-like Candles: Small bodies with long wicks suggest indecision or consolidation.
- Color Shifts: A switch in candle color can warn of trend reversals.
- Heikin Ashi vs. Candlestick Patterns: Patterns like hammers or engulfing candles still apply, but with a smoother context for better confirmation.
Recognizing these changes early gives traders a critical edge in adjusting or exiting positions.
Adapting Your Heikin Ashi Strategy to Different Markets
Heikin Ashi adapts well across market conditions and asset classes. In trending markets, it enhances trend-following systems. In sideways markets, it helps avoid whipsaws.
Adaptation Tips:
- Use trailing stop-losses during strong trends.
- Apply moving averages to confirm direction.
- Look for divergence between Heikin Ashi and indicators like RSI for reversals.
Whether you’re trading commodities, forex, or stocks, Heikin Ashi provides valuable insights for fine-tuning your approach.
Best Indicators to Use When Trading with Heikin Ashi
Combining Heikin Ashi with technical indicators can enhance reliability and timing.
Recommended Indicators:
- MACD: Helps confirm long-term trend strength.
- RSI: Detects overbought/oversold conditions for timing entries/exits.
- Moving Averages: Confirm momentum and filter trades.
| Indicator | Trending Markets | Ranging Markets |
|---|---|---|
| RSI | Great for timing pullbacks | Risk of false signals |
| MACD | Confirms momentum & direction | Can lag or misfire |
| Moving Averages | Ideal for trend-following setups | Less effective in choppy markets |
FAQ: What’s the Best Indicator to Pair with Heikin Ashi?
There’s no universal answer, but many traders combine Heikin Ashi with MACD to strengthen trend confirmation and improve reversal detection.
Want Better Results? Heikin Ashi Trading Tips That Work
Heikin Ashi supports both swing trading and day trading patterns by simplifying the chart view and clarifying trend direction.
How It Works:
- Heikin Ashi averages price data for a clearer chart.
- It’s best used in trending environments.
When to Use:
- In trending markets, to reduce the distraction of small price movements.
- In combination with moving averages and RSI to improve entry/exit timing.
Actionable Tips:
- Backtest your setups on historical data.
- Demo Trade before committing real capital.
- Use multiple timeframes to spot both short-term and long-term trends.
FAQ: What Is the Best Strategy for Heikin Ashi?
A strong approach combines Heikin Ashi with support/resistance, trend-following indicators, and risk management tools like stop-losses. This blend works well across various investment strategies.
Thinking About Heikin Ashi? Get Ready to Trade Smarter
If you’re considering adding Heikin Ashi to your charting toolkit, it may improve your decision-making by providing cleaner visuals and stronger trend cues.
How It Works:
- Uses average pricing to simplify charts.
- Enhances your ability for identifying trends in trading.
When to Use It:
- Perfect for day traders or swing traders needing clearer entries and exits.
- Helps stay in trades longer during strong trends.
Combining Tools:
- Use with RSI, MACD, or moving averages for deeper insight.
- Incorporate support/resistance levels for optimal trade execution.
Heikin Ashi Benefits Summary
| Benefit | Result |
|---|---|
| Reduces market noise | Cleaner, more reliable signals |
| Clarifies trend | Easier to assess strength and direction |
| Simple to read | Great for both beginners and experienced traders |
Want to improve your trading strategies with Heikin Ashi? Join Above the Green Line membership for insights, tools, and expert guidance to sharpen your edge.

Related Articles

Margin Call Explained: What Triggers It and How to Avoid One

AMC Short Squeeze Explained: Timeline, Causes, and Trading Risks

Volatility Clustering in Financial Markets: Understand Why It Happens

Chaikin Money Flow (CMF): How to Use Volume to Spot Real Market Strength
