
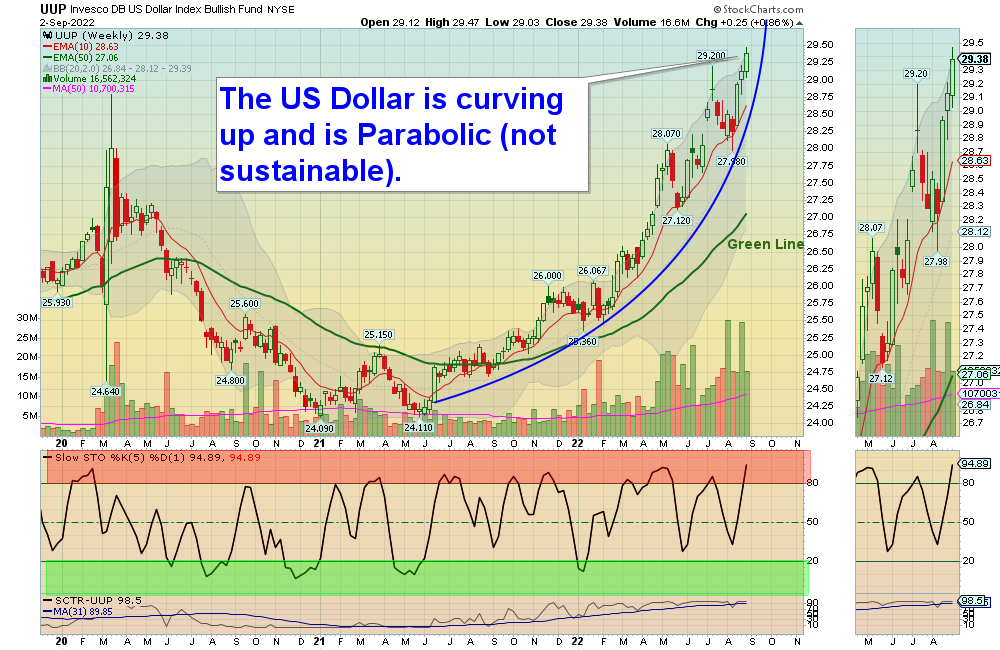
9/4/2022 Markets were sharply lower again this week as steady and mild selling continued. The Markets are adjusting for more FED tightening (raising Fed Funds rate) another 3/4% on Sept 21. This has caused the US Dollar to soar and now the Chart is in a Parabolic curve. Parabolic curves represent a Climax of human emotion, and historically are not sustainable.
The FED has told the Herd that they might have to tighten many more times in the future, so the Herd (Dumb Money) has been selling Stocks Way Below the Green Line, on FEAR. Eventually the US Dollar will peak and return to the Green Line, after the FED admits that they were wrong, again.
The weak Tech and Semiconductor stocks should be able to rally up from Way below the Green Lines, back up towards the Green Lines when the US Dollar falls. The Indices are now over-sold, and a bullish pattern would be a Double Bottom or preferably a Higher Low than the low in June.
If you continue to Follow the Green Line System, your Money should flow into the Strongest areas and your account value should be able to grow in both Bull and Bear Markets.
________________________________________________________________________________________________________________________________________________
More action this week on the Day Trading Scrolling Charts.
DAY TRADING CHARTS FOR INDICES & LARGE CAPS.
We have not had many intra-day Trade Alert signals lately as the Volume has been too Low with the Buy Signals. These low Volume Buy Signals tend to pop up and quickly fade back down. We like to see High Volume on rallies.
For the week the Dow was down 2.84%, the S&P 500 was down 3.22%, and the NASDAQ 100 down 3.99%. Currently the major Stock Indices are now back Below the Green Lines and have low Relative Strength (own stronger Investments here).
The Inflation Index (CRB) was down 4.59% for the week and is Above the Green Line, indicating Economic Expansion.
Bonds were down 2.79 for the week, and are Below the Green Line, indicating Economic Expansion.
The US DOLLAR was up 0.70% for the week (a New High) and is Way Above the Green Line.
Crude Oil was down 6.65% for the week at $86.87 and GOLD was down 1.55% at $1722.60.
_____________________________________________________________________________________________
MONEY WAVE BUYS SOON:
We are in now in 6 logged Current Positions for the Short & Medium Term. There are 9 investments on the Short Term Watch List.
Be patient and WAIT for Green Zone Buy Signals!
_________________________________________________________________________________________
LONG TERM INVESTMENTS: (Hard to find many Long Term now because most normal Investments no longer have 80 Relative Strength required.)
Long Term Scrolling Charts (Real Time)
ABBV ABBVIE INC. Buy if it Closes above $143.98 with High Volume.
GOGL GOLDEN OCEAN GROUP Buy if it Closes above $11.37 with High Volume.
USO US OIL FUND Buy if it Closes above $76.97 with High Volume.
VIPS VIPSHOP HOLDINGS Buy if it Closes above $13.32 with High Volume. (now in nice Stage 1 Base).
_______________________________________________________________________________
My Trading Dashboard
Swing Trading Scrolling Charts
Day Trading Scrolling Charts
Click for Watch Lists
Click for Current Positions
Click for Closed Positions
Updated Top 100 List Sep 1, 2022
Dividend Growth Portfolio
Updated ETF Sector Rotation System
Dogs of the DOW System
Long Term Strategy for IRAs & 401k Plans
CNN Fear & Greed Index
Scrolling Stage Chart Investing Charts
Alert! Market Risk is Medium (YELLOW). The probability of successful Short Term Trades is better, when the % of stocks above the 50-day avg. is below 20.
Tell your Friends about the Green Line, and Help Animals.
________________________________________________________________________________
4 Ways to Get your Daily Money Wave Email Alert:
-
- Emailed to your box between 3:45 – 3:50 pm EST.
- Website menu Commentary/Buy/Sell Signals
- Twitter notifications are the fastest @AboveGreenLine
- Text messages: Email us your Cell number & phone carrier.
Thank you,
ATGL
Related Post
– ABBV