
8/28/2022 Markets were sharply lower for the week as sellers dumped on Friday’s FED News. The Indices were over-bought, and most stocks were too far above the Red Lines (50-day avgs.) Now the Indices are quickly back down slightly below the Red Lines, and need to bounce up soon to maintain the uptrend.
We like to Buy on FEAR, but after a 17% rally on the S&P 500 Index into mid August, the FEAR was mostly gone. We took more profits this week (please see below). Now the FEAR is returning after a quick 6.5 % drop.
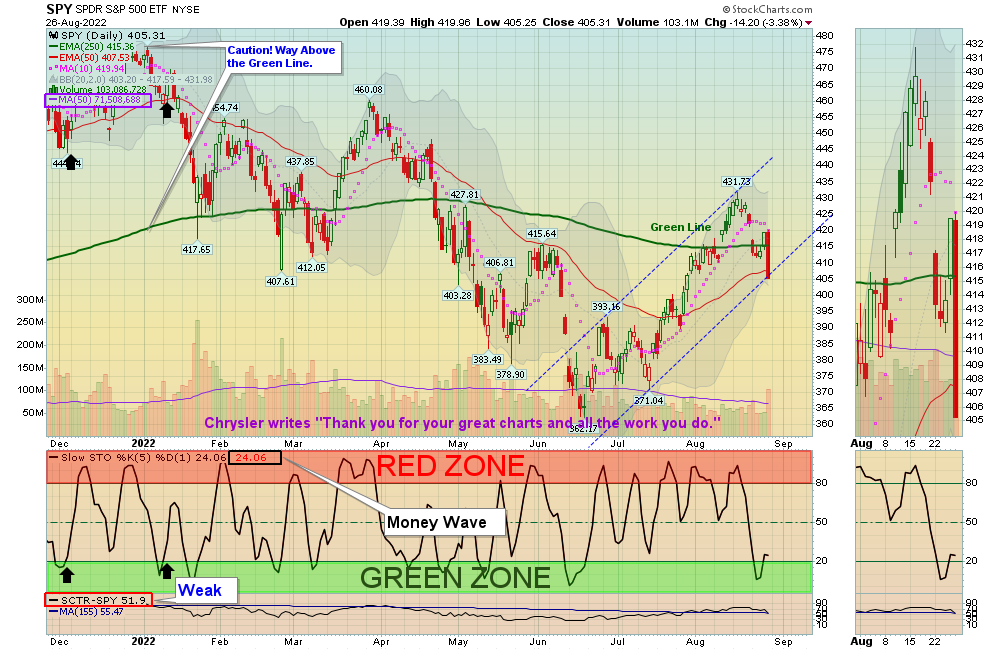
If the Elliott Wave count is correct, we could see the Market complete Wave 4 down very soon and start back up on Wave 5 up. Wave 5 up should re-test the mid August highs, or higher.
If you continue to Follow the Green Line System, your Money should flow into the Strongest areas and your account value should be able to grow in both Bull and Bear Markets.
Completed Trades this week:
ENVX ENOVIX CORP. Target Hit at $24 for a 12.5 % Gain. This trade was not logged.
PLUG PLUG POWER Target was Hit at $30 for a 13.2 % Gain.
TBT INVERSE T-BOND FUND Stopped Out for a 10.1 % Gain.
UUP US DOLLAR FUND Target was Hit at $29.15 for a 2.5 % Gain.
XLE ENERGY STOCK FUND Target was Hit $82 for an 11.6 % Gain. This trade was not logged.
________________________________________________________________________________________________________________________________________________
More action this week on the Day Trading Scrolling Charts.
DAY TRADING CHARTS FOR INDICES & LARGE CAPS.
We have not had many intra-day Trade Alert signals lately as the Volume has been too Low with the Buy Signals. These low Volume Buy Signals tend to pop up and quickly fade back down. We like to see High Volume on rallies.
For the week the Dow was down 4.19%, the S&P 500 was down 3.99%, and the NASDAQ 100 down 4.78%. Currently the major Stock Indices are now back Below the Green Lines and have low Relative Strength (own stronger Investments here).
The Inflation Index (CRB) was up 3.09% for the week and is Above the Green Line, indicating Economic Expansion.
Bonds were up 0.51% for the week, and are Below the Green Line, indicating Economic Expansion.
The US DOLLAR was up 0.60% for the week and is Way Above the Green Line.
Crude Oil was up 2.90% for the week at $93.06 and GOLD was down 0.74% at $1749.80.
_____________________________________________________________________________________________
MONEY WAVE BUYS SOON:
We are in now in 5 logged Current Positions for the Short & Medium Term. There are 4 investments on the Short Term Watch List.
Be patient and WAIT for Green Zone Buy Signals!
_________________________________________________________________________________________
LONG TERM INVESTMENTS: (Hard to find many Long Term now because most normal Investments no longer have 80 Relative Strength required.)
Long Term Scrolling Charts (Real Time)
ABBV ABBVIE INC. Buy if it Closes above $143.98 with High Volume.
DBC COMMODITY FUND Closed above $26.32, but the Volume was not High.
GOGL GOLDEN OCEAN GROUP Buy if it Closes above $11.37 with High Volume.
USO US OIL FUND Buy if it Closes above $76.97 with High Volume.
_______________________________________________________________________________
My Trading Dashboard
Swing Trading Scrolling Charts
Day Trading Scrolling Charts
Click for Watch Lists
Click for Current Positions
Click for Closed Positions
Updated Top 100 List Aug 1, 2022
Dividend Growth Portfolio
Updated ETF Sector Rotation System
Dogs of the DOW System
Long Term Strategy for IRAs & 401k Plans
CNN Fear & Greed Index
Scrolling Stage Chart Investing Charts
Alert! Market Risk is Medium (YELLOW). The probability of successful Short Term Trades is better, when the % of stocks above the 50-day avg. is below 20.
Tell your Friends about the Green Line, and Help Animals.
________________________________________________________________________________
QUESTION: Jackie writes “Is there a way I can enter a stock such as BA or an ETF symbols and see them shown as ATGL chart with red/green zones, MAs, sector ranking, Green Line, etc?”
ANSWER: Yes. Near the bottom of each Daily email, look for: ARE YOUR INVESTMENTS ABOVE THE GREEN LINE?
Please Click on the link (To make the Chart larger, please change the SIZE to Landscape and then Update.)
Good trading and tell your friends!
Related Post
– ABBV


