
8/21/2022 Markets were lower for the week on mild profit taking. The Indices had rallied up for 4 straight weeks and were over-bought. Many Indices are back up Above the Green Lines, which is Bullish. But most stocks are currently too far above the Red Lines (50-day avgs.) so the Swing Traders have quit buying for a while.
We like to Buy on FEAR, but after a 17% rally on the S&P 500 Index, the FEAR is mostly gone. We have taken more profits this week (please see below).
If the Elliott Wave count is correct, we could see the Market stall or pull back towards the Red Line (50-day avg.) like it always does. This would be normal profit taking after a huge rally in 2 months.
If you continue to Follow the Green Line System, your Money should flow into the Strongest areas and your account value should be able to grow in both Bull and Bear Markets.
Completed Trades this week:
BTU PEABODY ENERGY Target was Hit at $24 for a 19.6 % Gain.
LLY ELI LILLY & CO. Target Hit at $320 for a 5 % Gain.
XLP CONSUMERS STAPLES FUND Target was Hit at $76 for a 2.7 % Loss.
XOP OIL & GAS SERVICES FUND Target Hit at $145 for a 13.2 % Gain. (Long Term Portfolio).
________________________________________________________________________________________________________________________________________________
More action this week on the Day Trading Scrolling Charts.
DAY TRADING CHARTS FOR INDICES & LARGE CAPS.
We have not had many intra-day Trade Alert signals lately as the Volume has been too Low with the Buy Signals. These low Volume Buy Signals tend to pop up and quickly fade back down. We like to see High Volume on rallies.
For the week the Dow was down 0.04%, the S&P 500 was down 1.16%, and the NASDAQ 100 down 2.28%. Currently the major Stock Indices are now back Above the Green Lines but have lower Relative Strength (own stronger Investments here).
The Inflation Index (CRB) was down 0.49% for the week and is Above the Green Line, indicating Economic Expansion.
Bonds were down 2.17% for the week, and are Below the Green Line, indicating Economic Expansion.
The US DOLLAR was up 2.45% for the week and is Way Above the Green Line.
Crude Oil was down 1.79% for the week at $90.09 and GOLD was down 2.90% at $1762.90.
_____________________________________________________________________________________________
MONEY WAVE BUYS SOON:
We are in now in 7 logged Current Positions for the Short & Medium Term. There are 4 investments on the Short Term Watch List.
Be patient and WAIT for Green Zone Buy Signals!
_________________________________________________________________________________________
LONG TERM INVESTMENTS: (Hard to find many Long Term now because most normal Investments no longer have 80 Relative Strength required.)
Long Term Scrolling Charts (Real Time)
ABBV ABBVIE INC. Buy if it Closes above $145.44 with High Volume.
DBC COMMODITY FUND Buy if it Closes above $26.32 with High Volume.
GOGL GOLDEN OCEAN GROUP Buy if it Closes above $11.68 with High Volume.
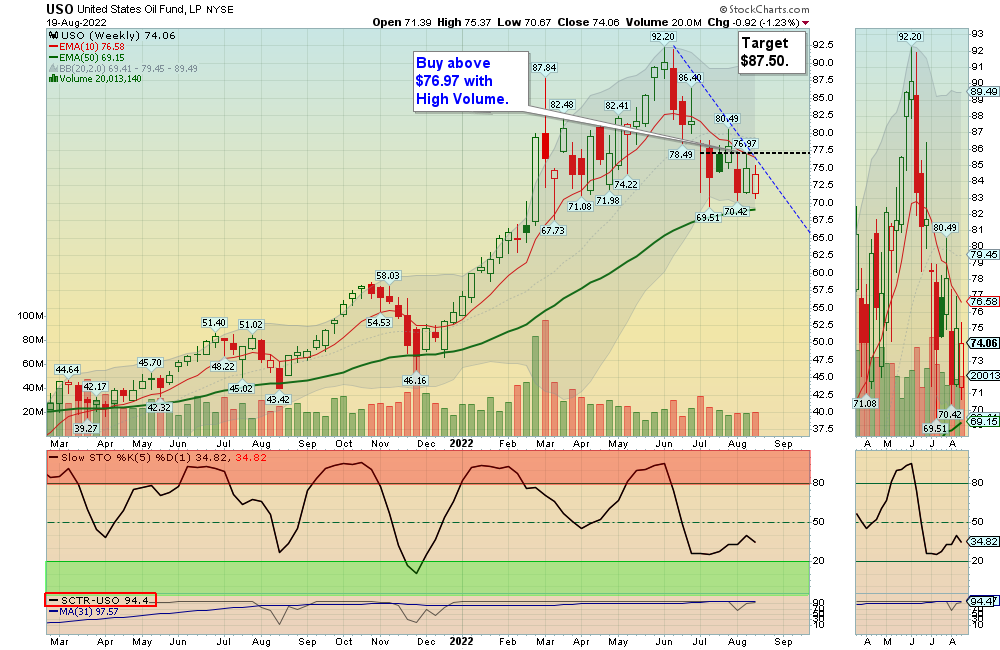
USO US OIL FUND Buy if it Closes above $76.97 with High Volume.
_______________________________________________________________________________
My Trading Dashboard
Swing Trading Scrolling Charts
Day Trading Scrolling Charts
Click for Watch Lists
Click for Current Positions
Click for Closed Positions
Updated Top 100 List Aug 1, 2022
Dividend Growth Portfolio
Updated ETF Sector Rotation System
Dogs of the DOW System
Long Term Strategy for IRAs & 401k Plans
CNN Fear & Greed Index
Scrolling Stage Chart Investing Charts
Alert! Market Risk is High (RED). The probability of successful Short Term Trades is better, when the % of stocks above the 50-day avg. is below 20.
Tell your Friends about the Green Line, and Help Animals.
________________________________________________________________________________
QUESTION: Jose M writes “Morning, I seem to have difficulties on finding the Money Wave chart on the ETFs. Thanks.”
ANSWER: First go to MY TRADING DASH BOARD. Then the Charts with the Money Waves can be pulled up by clicking on the Symbol of the Investment on the Watch List or Current Positions links in every Daily email.
The Money Wave is the Red and Green Zone on the bottom part of the Chart. Buy when the Money Wave has gone down into the Green Zone, and then turns up above 20.
Related Post
– DBC


