
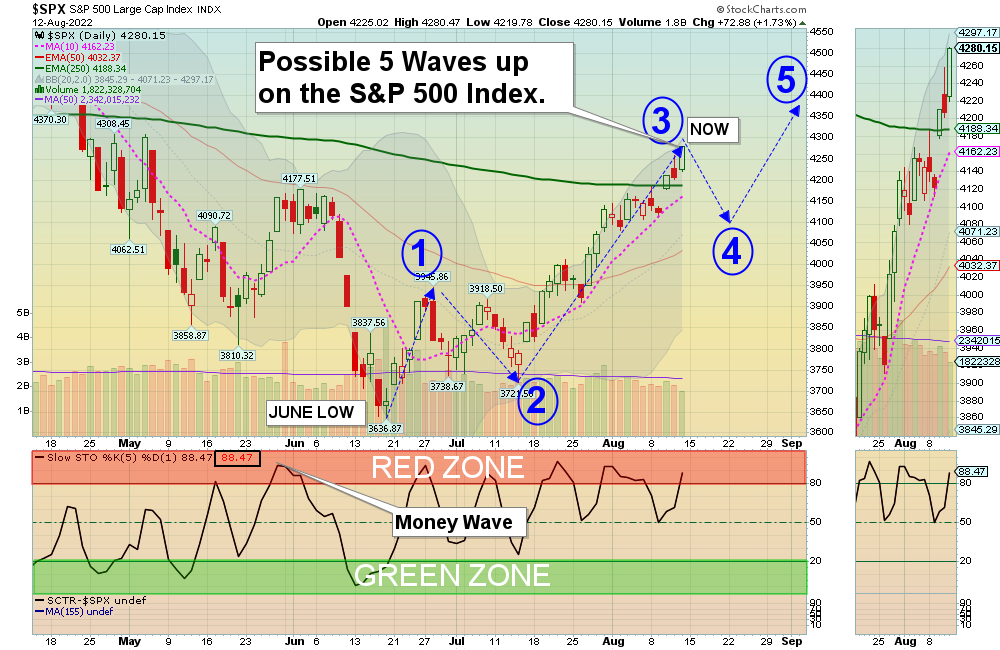
8/14/2022 Markets were higher again for the week as the Indices have rallied up for 4 straight weeks, Many Indices are back up Above the Green Lines. The Media flushed investors out on FEAR in June, but now the Market sentiment is the most Bullish since March (GREED is back in). Smart Money Bought on FEAR in June, and now the S&P 500 has quickly rallied 17 % from the lows.
If the Elliott Wave count above is correct, we could see the Market stall or pull back towards the Red Line (50-day avg.) like it always does. This would be normal profit taking after a huge 17% rally in 2 months.
Based on the upward momentum and probability, Commodities and long term Interest Rates should go up once more to re-test the Highs. Remember when the Green Line Weekly wrote that when Commodities correct back down to the Green Line, that the Media would declare that Inflation had peaked (and now FEAR has disappeared)?
If you continue to Follow the Green Line System, your Money should flow into the Strongest areas and your account value should be able to grow in both Bull and Bear Markets.
________________________________________________________________________________________________________________________________________________
More action this week on the Day Trading Scrolling Charts.
DAY TRADING CHARTS FOR INDICES & LARGE CAPS.
We have not had many intra-day Trade Alert signals lately as the Volume has been too Low with the Buy Signals. These low Volume Buy Signals tend to pop up and quickly fade back down. We like to see High Volume on rallies.
For the week the Dow was up 3.01%, the S&P 500 was up 3.30%, and the NASDAQ 100 was up 2.69%. Currently the major Stock Indices are now back Above the Green Lines but have lower Relative Strength (own stronger Investments here).
The Inflation Index (CRB) was up 4.43% for the week and is Above the Green Line, indicating Economic Expansion.
Bonds were down 0.79% for the week, and are Below the Green Line, indicating Economic Expansion.
The US DOLLAR was down 0.92% for the week and is Way Above the Green Line.
Crude Oil was up 3.46% for the week at $92.09 and GOLD was up 1.36% at $1815.50.
_____________________________________________________________________________________________
MONEY WAVE BUYS SOON:
We are in now in 8 logged Current Positions for the Short & Medium Term. There are only 2 investments on the Short Term Watch List.
Be patient and WAIT for Green Zone Buy Signals!
_________________________________________________________________________________________
LONG TERM INVESTMENTS: (Hard to find many Long Term now because most normal Investments no longer have 80 Relative Strength required.)
Long Term Scrolling Charts (Real Time)
DBC COMMODITY FUND Buy if it Closes above $26.32 with High Volume.
GOGL GOLDEN OCEAN GROUP Closed above $11.40 but the Volume was not High. (5% Trailing Sell Stop Loss below it.)
TBF INVERSE T-BOND FUND Closed above $19.75 but the Volume was not High. (3% Trailing Sell Stop Loss below it.)
_______________________________________________________________________________
My Trading Dashboard
Swing Trading Scrolling Charts
Day Trading Scrolling Charts
Click for Watch Lists
Click for Current Positions
Click for Closed Positions
Updated Top 100 List Aug 1, 2022
Dividend Growth Portfolio
Updated ETF Sector Rotation System
Dogs of the DOW System
Long Term Strategy for IRAs & 401k Plans
CNN Fear & Greed Index
Scrolling Stage Chart Investing Charts
Alert! Market Risk is High (RED). The probability of successful Short Term Trades is better, when the % of stocks above the 50-day avg. is below 20.
Tell your Friends about the Green Line, and Help Animals.
________________________________________________________________________________
Ron S writes “I just want to say I really love your NEW Dashboard. My first day looking over the information was a pain going all over the site. The Dashboard is comprehensive. I will now RESUME my membership.


