
8/7/2022 Markets were slightly higher this week as the Indices have rallied back up near the Green Lines. Normally the Markets would stall near the Green Lines or go back down after a big rally with only average Volume.
In June the Stock Indices were Way Below the Green Lines, and the Strong Commodities and long term Interest Rates were Way Above the Green Lines. The Green Line told us that Stocks should rally and Oil & long term Interest Rates should fall (which is EXACTLY what happened).
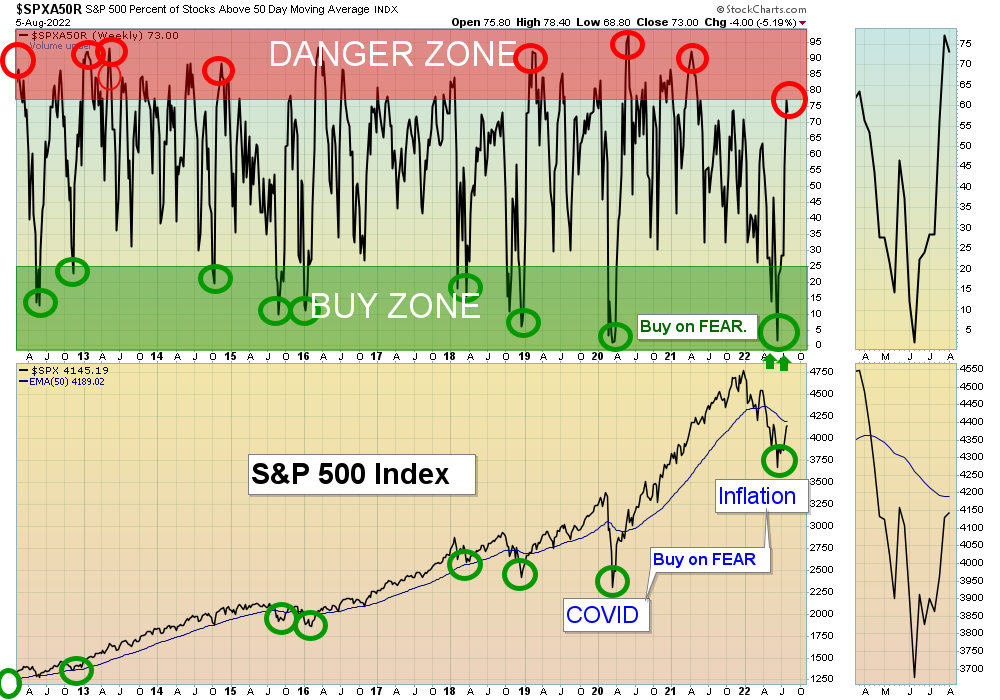
The Media caused investor FEAR, and Dumb Money sold the S&P 500 Fund Way Below the Green Line, and down in the Green Zone. Most investors were certain that Oil prices & Interest Rates would remain high, and a that a Recession would cause Stocks to go lower. Instead the S&P 500 Fund bounced 13.8 % and Oil dropped 29 %. The Green Line System bought on the FEAR, and captured some nice Gains this week.
So what will happen next? Based on probability and not prediction (like the Media uses), the strongest Charts of Oil, Interest Rates and Commodities have corrected down near the Green Lines, and will normally go back up to re-test the Highs. This would probably put selling pressure on Stocks. The S&P 500 Fund is quickly back up in the Red Zone on the Chart above (probably too late to Buy on this cycle).
If you continue to Follow the Green Line System, your Money should flow into the Strongest areas and your account value should be able to grow in both Bull and Bear Markets.
COMPLETED TRADES THIS WEEK
AR ANTERO RESOURCES Stopped Out on the Close for a 18.8 % Gain.
BLU BELLUS HEALTH Target was Hit for a 10.4 % Gain.
CTIC CTI BIOPHARMA Target was Hit at $6.75 for an 8.9 % Gain.
LI LI AUTO INC. Stopped Out on the Close for a 1.34 % Gain.
OXY OCCIDENTAL PETE Stopped Out on the Close for a 9.36 % Gain.
XLE ENERGY STOCK FUND Stopped Out on the Close for an 8.6 % Gain.
XOM EXXON MOBIL Stopped Out on the Close for an 6.7 % Gain. ________________________________________________________________________________________________________________________________________________
More action this week on the Day Trading Scrolling Charts.
DAY TRADING CHARTS FOR INDICES & LARGE CAPS.
We have not had many intra-day Trade Alert signals lately as the Volume has been too Low with the Buy Signals. These low Volume Buy Signals tend to pop up and quickly fade back down. We like to see High Volume on rallies.
For the week the Dow was down 0.21%, the S&P 500 was up 0.38%, and the NASDAQ 100 was up 1.99%. Currently the major Stock Indices are Below the Green Lines (AVOID and own stronger Investments here).
The Inflation Index (CRB) was down 3.77% for the week and is Above the Green Line, indicating Economic Expansion.
Bonds were down 0.64% for the week, and are Way Below the Green Line, indicating Economic Expansion.
The US DOLLAR was up 0.67% for the week and is Way Above the Green Line.
Crude Oil was down 9.74% for the week at $89.01 and GOLD was up 0.53% at $1791.20.
_____________________________________________________________________________________________
MONEY WAVE BUYS SOON
We are in now in 7 logged Current Positions for the Short & Medium Term. There are 7 investments on the Short Term Watch List.
Be patient and WAIT for Green Zone Buy Signals!
_________________________________________________________________________________________
LONG TERM INVESTMENTS (Hard to find many Long Term now because most normal Investments no longer have 80 Relative Strength required.)
Long Term Scrolling Charts (Real Time)
DBC COMMODITY FUND Buy if it Closes above the Red Line with High Volume.
GOGL GOLDEN OCEAN GROUP Buy above $11.40 with High Volume with a 5% Trailing Sell Stop Loss below it.
TBF INVERSE T-BOND FUND Buy above $19.75 with High Volume with a 5% Trailing Sell Stop Loss below it.
_______________________________________________________________________________
My Trading Dashboard
Swing Trading Scrolling Charts
Day Trading Scrolling Charts
Click for Watch Lists
Click for Current Positions
Click for Closed Positions
Updated Top 100 List Aug 1, 2022
Dividend Growth Portfolio
Updated ETF Sector Rotation System
Dogs of the DOW System
Long Term Strategy for IRAs & 401k Plans
CNN Fear & Greed Index
Scrolling Stage Chart Investing Charts
Alert! Market Risk is High (RED). The probability of successful Short Term Trades is better, when the % of stocks above the 50-day avg. is below 20.
Tell your Friends about the Green Line, and Help Animals.
________________________________________________________________________________
4 Ways to Get your Daily Money Wave Email Alert:
-
- Emailed to your box between 3:45 – 3:50 pm EST.
- Website menu Commentary/Buy/Sell Signals
- Twitter notifications are the fastest @AboveGreenLine
- Text messages: Email us your Cell number & phone carrier.
Thank you,
ATGL


