
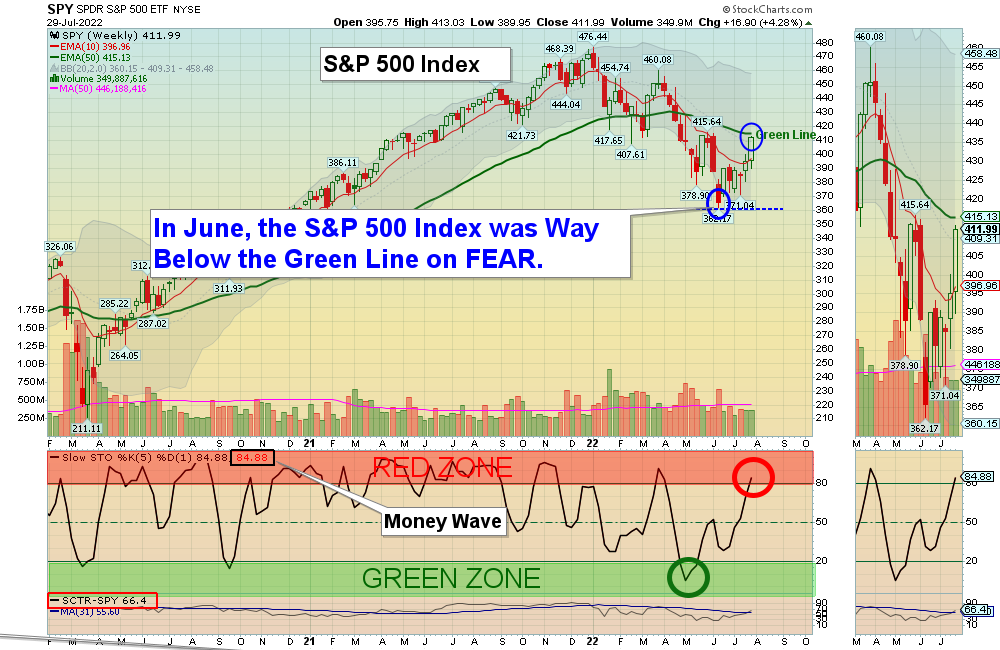
7/31/2022 Markets were sharply higher for the week as the Indices finally rallied back up near the Green Lines. In June the Media caused FEAR and Dumb Money Sold the S&P 500 Fund Way Below the Green Line, and down in the Green Zone. Now the S&P 500 Fund has bounced 13.8 % and the S&P 500 Fund is quickly back up in the Red Zone (probably too late to Buy on this cycle).
Normally the Markets would stall near the Green Line or go back down after a big rally with average Volume. 60 % of investments are still Below the Green Lines, and many have not bounced up much at all. It would normally require the “sugar high” of FED Printing to get the Markets back Above the Green Lines (which could happen later this year.
But all of the sudden, Congress is trying to ram through another $740 BILLION Spending Bill soon. This could be the “sugar high” that the Markets need to go higher, so lets see if it passes, or not.
Short term the strongest Charts of US Dollar, Interest Rates and Commodities have corrected, and will normally go back up to re-test the Highs. This would probably put selling pressure on Stocks.
If you continue to Follow the Green Line System, your Money should flow into the Strongest areas and your account value should be able to grow in both Bull and Bear Markets.
More action this week on the Day Trading Scrolling Charts.
DAY TRADING CHARTS FOR INDICES & LARGE CAPS.
We have not had many intra-day Trade Alert signals lately as the Volume has been too Low with the Buy Signals. These low Volume Buy Signals tend to pop up and quickly fade back down. We like to see High Volume on rallies.
For the week the Dow was up 3.01%, the S&P 500 was up 4.28%, and the NASDAQ 100 was up 4.46%. Currently the major Stock Indices are Below the Green Lines (AVOID and own stronger Investments here).
The Inflation Index (CRB) was up 3.88% for the week and is Above the Green Line, indicating Economic Expansion.
Bonds were down 0.79% for the week, and are Way Below the Green Line, indicating Economic Expansion.
The US DOLLAR was down 1.20% for the week and is Way Above the Green Line.
Crude Oil was up 4.14% for the week at $98.62 and GOLD was up 3.15% at $1781.80.
_____________________________________________________________________________________________
MONEY WAVE BUYS SOON
We are in now in 8 logged Current Positions for the Short & Medium Term. There are 5 investments on the Short Term Watch List.
Be patient and WAIT for Green Zone Buy Signals!
_________________________________________________________________________________________
LONG TERM INVESTMENTS (Hard to find many Long Term now because most normal Investments no longer have 80 Relative Strength required.)
Long Term Scrolling Charts (Real Time)
DBC COMMODITY FUND Buy if it Closes above the Red Line with High Volume.
GOGL GOLDEN OCEAN GROUP Buy above $11.20 with High Volume with a 5% Trailing Sell Stop Loss below it.
MOS MOSIAC CO. Closed above Red Line and popped 10.5 %, but on Low Volume. Target $70. Don’t Take a Loss!
NUE NUCOR CORP. (Steel) Popped up another 13% this week. Probably missed it.
PBR PETROBRAS ENERGY Bought above $12.21 and popped up 22.7 %. Target is $14.75. Don’t Take a Loss!
XLE ENERGY STOCK FUND Closed above $73.35 and was up 10 % but the Volume was not High (Not Logged).
XOP OIL & GAS EXPLORATION FUND Closed above $127.95 and was up 13 % but the Volume was not High (Not Logged).
_______________________________________________________________________________
My Trading Dashboard
Swing Trading Scrolling Charts
Day Trading Scrolling Charts
Click for Watch Lists
Click for Current Positions
Click for Closed Positions
Updated Top 100 List Jul 1, 2022
Dividend Growth Portfolio
Updated ETF Sector Rotation System
Dogs of the DOW System
Long Term Strategy for IRAs & 401k Plans
CNN Fear & Greed Index
Scrolling Stage Chart Investing Charts
Alert! Market Risk is Medium (YELLOW). The probability of successful Short Term Trades is better, when the % of stocks above the 50-day avg. is below 20.
Tell your Friends about the Green Line, and Help Animals.
________________________________________________________________________________
QUESTION: Jeff writes “Hello, in trying to understand your “DONT TAKE A LOSS” comments. Why don’t you raise the stop loss when the stock pops up so much? I am not capturing a lot of upside, as I wait and get out conservatively. Is the point to let them run with a large stop loss to capture maximum upside?
ANSWER: Hi Jeff. When a Stock is really running, having a Stop below the Pink Line usually works well. But sometimes they “Gap Up” way above all averages. There is no correct answer, except that we know that the Investment will eventually return to all of the averages. Try to judge if the Market is very Strong or not…
In the current Market, we are capturing smaller Gains… Holding on for more could be determined by calculating the Reward / Risk ratio of 2:1. (Can it go up $4 more with downside of only $2?) Also some members want to see more longer term results by strictly following the Rules.
When the Money Wave > 50, then the Stop is raised to the Buy Price. (Don’t Take a Loss!). Probability says to “Get Out Even” and wait for the next trade.
Thanks for writing.
ATGL


