
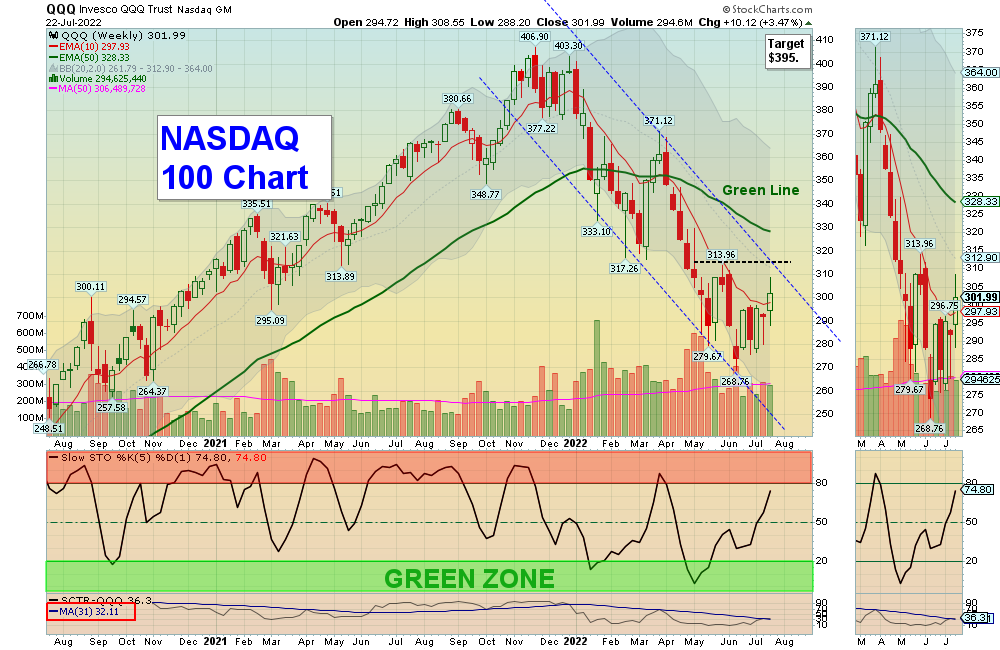
7/24/2022 Markets were higher for the week as the weaker “darling stocks” from last year finally popped up off the bottom. The FEAR has disappeared as some Earnings have been better than expected, and long term Interest Rates have dropped. So the Indices are returning up near the Green Line (like they always do).
The FED will probably raise short term Interest Rates 3/4 of a point on July 27th, and many are expecting more tightening in the future. But FED Tightening and the slower Economy has already caused the Commodities to drop 17 % off the Highs and long term Interest Rates are coming down. Weaker commodities like Steel, Copper, Aluminum, Silver & Lumber are now in Bear Markets (down trends).
Eventually the FED will realize that they tightened a year too late, and have probably tightened too much. Once the Market and Investors realize that the July 27th FED raise could be the last, we could see a more powerful rally in the Markets (back up near the Green Lines).
But for the Markets to return back up to the January Highs, we probably will need the “sugar high” of Printing from the FED again. It is possible that the FED could change course and begin Printing again before the November Elections…
The strongest Leaders are now back down to the Green Zones for Weekly Buy Signals below. A big Market sell off like we had helps us identify which investments are the strongest (still Above the Green Lines). Leading Energy, Commodities & Chemical Stocks should be able to re-test the recent Highs.
If you continue to Follow the Green Line System, your Money should flow into the Strongest areas and your account value should be able to grow in both Bull and Bear Markets.
More action this week on the Day Trading Scrolling Charts.
DAY TRADING CHARTS FOR INDICES & LARGE CAPS.
We have not had many intra-day Trade Alert signals lately as the Volume has been too Low with the Buy Signals. These low Volume Buy Signals tend to pop up and quickly fade back down. We like to see High Volume on rallies.
For the week the Dow was up 2.05%, the S&P 500 was up 2.59%, and the NASDAQ 100 was up 3.47%. Currently the major Stock Indices are Below the Green Lines (AVOID and own stronger Investments here).
The Inflation Index (CRB) was up 1.27% for the week and is Above the Green Line, indicating Economic Expansion.
Bonds were up 2.08% for the week, and are Way Below the Green Line, indicating Economic Expansion.
The US DOLLAR was down 1.20% for the week and is Way Above the Green Line.
Crude Oil was down 2.96% for the week at $94.70 and GOLD was up 1.40% at $1727.40.
_____________________________________________________________________________________________
MONEY WAVE BUYS SOON
We are in now in 7 logged Current Positions for the Short & Medium Term. There are 6 investments on the Short Term Watch List.
Be patient and WAIT for Green Zone Buy Signals!
_________________________________________________________________________________________
LONG TERM INVESTMENTS (Hard to find many Long Term now because most normal Investments no longer have 80 Relative Strength required.)
Long Term Scrolling Charts (Real Time)
CVS CVS HEALTH CORP. Buy above $96.57 with High Volume with a 3% Trailing Sell Stop Loss below it.
DBC COMMODITY FUND Wait for the next Weekly Money Wave Buy Signal with High Volume.
GOGL GOLDEN OCEAN GROUP Buy above $11.20 with High Volume with a 5% Trailing Sell Stop Loss below it.
MOS MOSIAC CO. Buy above the Red Line with High Volume with a 5% Trailing Sell Stop Loss below it.
NUE NUCOR CORP. (Steel) Popped up 10% above the Red Line (50-day avg.) with average Volume.
PBR PETROBRAS ENERGY Buy if it Closes above $12.21 with High Volume.
XLE ENERGY STOCK FUND Buy above $73.35 with High Volume with a 5% Trailing Sell Stop Loss below it.
XOP OIL & GAS EXPLORATION FUND Buy if it Closes above $127.95 with High Volume.
_______________________________________________________________________________
My Trading Dashboard
Swing Trading Scrolling Charts
Day Trading Scrolling Charts
Click for Watch Lists
Click for Current Positions
Click for Closed Positions
Updated Top 100 List Jul 1, 2022
Dividend Growth Portfolio
Updated ETF Sector Rotation System
Dogs of the DOW System
Long Term Strategy for IRAs & 401k Plans
CNN Fear & Greed Index
Scrolling Stage Chart Investing Charts
Alert! Market Risk is Medium (YELLOW). The probability of successful Short Term Trades is better, when the % of stocks above the 50-day avg. is below 20.
Tell your Friends about the Green Line, and Help Animals.
________________________________________________________________________________
QUESTION: Jose M writes “Morning, I seem to have difficulties on finding the Money Wave chart on the ETFs. Thanks.”
ANSWER: First go to MY TRADING DASH BOARD. Then the Charts with the Money Waves can be pulled up by clicking on the Symbol of the Investment on the Watch List or Current Positions links in every Daily email.
The Money Wave is the Red and Green Zone on the bottom part of the Chart. Buy when the Money Wave has gone down into the Green Zone, and then turns up above 20.


