
7/17/2022 Markets were mostly lower for the week as many investors continue to worry about the FED raising short term Interest Rates once more on July 27th. But FED Tightening has already caused the Commodities (-3.51%) and long term Interest Rates (-3.24%) to come back down towards the Green Lines, as the Economy slows down. Weaker commodities like Steel, Copper, Aluminum, Silver & Lumber are now in Bear Markets (down trends).
Now we are waiting on the FED to realize that they tightened a year too late, and have probably tightened too much. Once the Market realizes that the July 27th FED raise could be the last, we could see more power and good Buying coming back into the Markets (back up near the Green Lines like they always do).
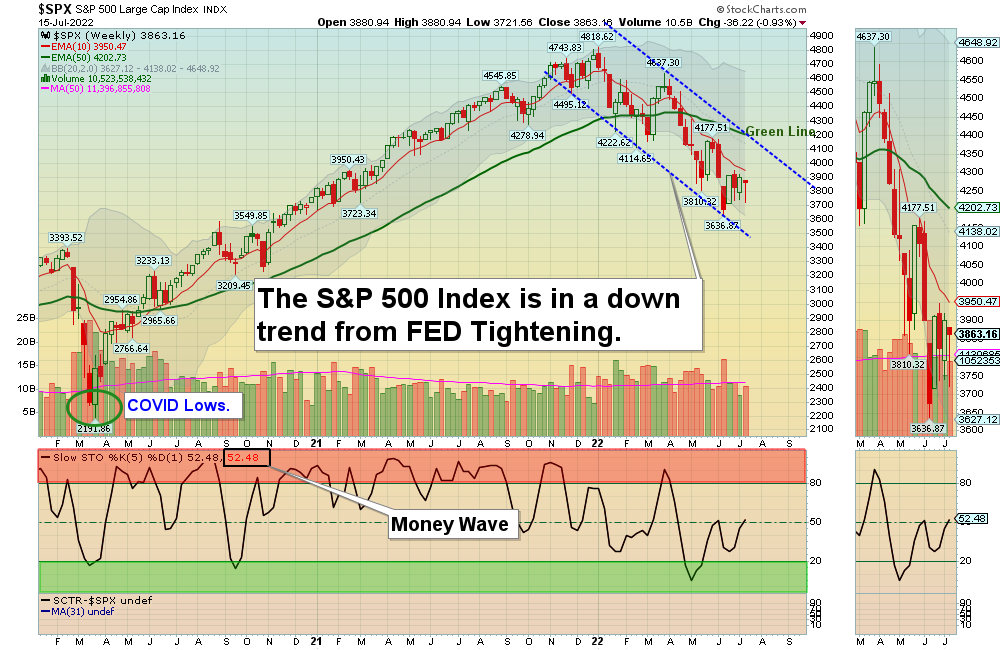
So far the Buying Volume has been weak as the Markets don’t have any power without the “sugar High” of Printing from the FED. But that could change when the S&P 500 Index closes above 3946 and fears of FED Tightening is over.
The strongest Leaders are now back down to the Green Zones for Weekly Buy Signals below. A big Market sell off like we had helps us identify which investments are the strongest (still Above the Green Lines). Leading Energy, Agriculture & Chemical Stocks should be able to re-test the recent Highs.
If you continue to Follow the Green Line System, your Money should flow into the Strongest areas and your account value should be able to grow in both Bull and Bear Markets.
More action this week on the Day Trading Scrolling Charts.
DAY TRADING CHARTS FOR INDICES & LARGE CAPS.
We have not had many intra-day Trade Alert signals lately as the Volume has been too Low with the Buy Signals. These low Volume Buy Signals tend to pop up and quickly fade back down. We like to see High Volume on rallies.
For the week the Dow was down 0.21%, the S&P 500 was down 0.91%, and the NASDAQ 100 was down 1.18%. Currently the major Stock Indices are Below the Green Lines (AVOID and own stronger Investments here).
The Inflation Index (CRB) was down 3.51% for the week and is Above the Green Line, indicating Economic Expansion.
Bonds were up 3.24% for the week, and are Way Below the Green Line, indicating Economic Expansion.
The US DOLLAR was up 1.02% for the week (a New High) and is Way Above the Green Line.
Crude Oil was down 6.87% for the week at $97.59 and GOLD was down 2.22% at $1703.60.
_____________________________________________________________________________________________
MONEY WAVE BUYS SOON
We are in now in 7 logged Current Positions for the Short & Medium Term. There are 5 investments on the Short Term Watch List.
Be patient and WAIT for Green Zone Buy Signals!
_________________________________________________________________________________________
LONG TERM INVESTMENTS (Hard to find many Long Term now because most normal Investments no longer have 80 Relative Strength required.)
Long Term Scrolling Charts (Real Time)
CVS CVS HEALTH CORP. Buy above $95.95 with High Volume with a 3% Trailing Sell Stop Loss below it.
DBC COMMODITY FUND Wait for the next Weekly Money Wave Buy Signal with High Volume.
GOGL GOLDEN OCEAN GROUP Wait for the next Weekly Money Wave Buy Signal with High Volume.
MOS MOSIAC CO. Wait for the next Weekly Money Wave Buy Signal with High Volume.
NUE NUCOR CORP. (Steel) Buy if it Closes above the Red Line (50-day avg.) with High Volume.
PBR PETROBRAS ENERGY Buy if it Closes above $12.21 with High Volume.
XLE ENERGY STOCK FUND Wait for the next Weekly Money Wave Buy Signal with High Volume.
XOP OIL & GAS EXPLORATION FUND Wait for the next Weekly Money Wave Buy Signal with High Volume.
_______________________________________________________________________________
My Trading Dashboard
Swing Trading Scrolling Charts
Day Trading Scrolling Charts
Click for Watch Lists
Click for Current Positions
Click for Closed Positions
Updated Top 100 List Jul 1, 2022
Dividend Growth Portfolio
Updated ETF Sector Rotation System
Dogs of the DOW System
Long Term Strategy for IRAs & 401k Plans
CNN Fear & Greed Index
Scrolling Stage Chart Investing Charts
Alert! Market Risk is Low (GREEN). The probability of successful Short Term Trades is better, when the % of stocks above the 50-day avg. is below 20.
Tell your Friends about the Green Line, and Help Animals.
________________________________________________________________________________
QUESTION: Kinch writes “I am only receiving a notification about the market about 10 minutes before the market closes. I never get a text message about any trades. Is this the way it works?”
ANSWER: Hi Kinch. Most subscribers do best with the End of Day Swing Trading (Daily email arrives just before the Market Close).
We do send out Day Trade Alerts by Twitter when the Volume is High on the Triple Buy Signal. But that is not happening now with the FED Tightening of short term Interest Rates… We can help you set up a free Twitter account. These Alerts are also on the Main Menu: Stock Alerts
For Twitter, please install the app on your cell, and set up mobile notifications:
Please Follow Us @AboveGreenLine on Twitter and click on the bell icon to set up mobile notifications.
Thanks for writing,
ATGL


