
7/10/2022 Markets were higher for the week as the Indices made a Higher Low than in June. This could show that the Sellers are washed out, but the Buying Volume was not impressive. FEAR was High, so Smart Money Bought. But the Markets don’t have any power without the “sugar High” of Printing from the FED. And the FED will probably raise short term Interest Rates once more on Wednesday.
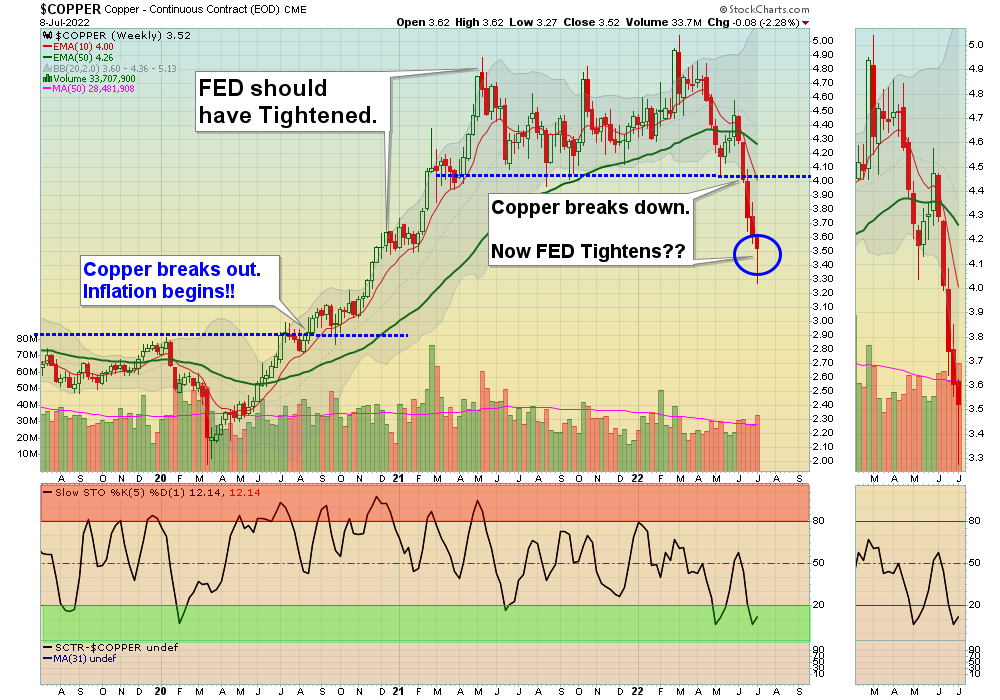
But FED Tightening has already caused the leading Commodities and long term Interest Rates to come back down towards the Green Lines, as the Economy slows down. Now we are waiting on the FED to realize that they tightened a year too late, and have probably tightened too much. Once the Market perceives that Inflation has peaked and the FED becomes more dovish on raising short term Rates, we should see more power and good Buying coming back into the Markets (back up near the Green Lines like they always do).
The strongest Leaders returned back down to the Green Zones for Buy Signals. A big Market sell off like we had helps us identify which investments are the strongest. Leading Energy, Agriculture & Chemical Stocks should be able to re-test the recent Highs.
If you continue to Follow the Green Line System, your Money should flow into the Strongest areas and your account value should be able to grow in both Bull and Bear Markets.
More action this week on the Day Trading Scrolling Charts.
DAY TRADING CHARTS FOR INDICES & LARGE CAPS.
We have not had many intra-day Trade Alert signals lately as the Volume has been too Low with the Buy Signals. These low Volume Buy Signals tend to pop up and quickly fade back down. We like to see High Volume on rallies.
For the week the Dow was up 0.84%, the S&P 500 was up 1.95%, and the NASDAQ 100 was up 4.69%. Currently the major Stock Indices are Below the Green Lines (AVOID and own stronger Investments here).
The Inflation Index (CRB) was down 1.40% for the week and is Above the Green Line, indicating Economic Expansion.
Bonds were down 2.87% for the week, and are Way Below the Green Line, indicating Economic Expansion.
The US DOLLAR was up 1.82% for the week (a New High) and is Way Above the Green Line.
Crude Oil was down 3.36% for the week at $104.79 and GOLD was down 3.29% at $1742.30.
_____________________________________________________________________________________________
MONEY WAVE BUYS SOON
We are in now in 7 logged Current Positions for the Short & Medium Term. There are 3 investments on the Short Term Watch List.
Be patient and WAIT for Green Zone Buy Signals!
_________________________________________________________________________________________
LONG TERM INVESTMENTS (Hard to find many Long Term now because most normal Investments no longer have 80 Relative Strength required.)
Long Term Scrolling Charts (Real Time)
CVS CVS HEALTH CORP. Buy above $95.95 with High Volume with a 3% Trailing Sell Stop Loss below it.
GOGL GOLDEN OCEAN GROUP Wait for the next Weekly Money Wave Buy Signal with High Volume.
MOS MOSIAC CO. Wait for the next Weekly Money Wave Buy Signal with High Volume.
NUE NUCOR CORP. (Steel) Wait for the next Weekly Money Wave Buy Signal with High Volume.
PBR PETROBRAS ENERGY Wait for the next Weekly Money Wave Buy Signal with High Volume.
XLE ENERGY STOCK FUND Wait for the next Weekly Money Wave Buy Signal with High Volume.
XOP OIL & GAS EXPLORATION FUND Wait for the next Weekly Money Wave Buy Signal with High Volume.
_______________________________________________________________________________
My Trading Dashboard
Swing Trading Scrolling Charts
Day Trading Scrolling Charts
Click for Watch Lists
Click for Current Positions
Click for Closed Positions
Updated Top 100 List Jul 1, 2022
Dividend Growth Portfolio
Updated ETF Sector Rotation System
Dogs of the DOW System
Long Term Strategy for IRAs & 401k Plans
CNN Fear & Greed Index
Scrolling Stage Chart Investing Charts
Alert! Market Risk is Low (GREEN). The probability of successful Short Term Trades is better, when the % of stocks above the 50-day avg. is below 20.
Tell your Friends about the Green Line, and Help Animals.
________________________________________________________________________________
QUESTION: Steve V. writes “Do you do both long and short positions or does someone just invert the rules in a down market?”
ANSWER: Yes, invert the Rules to Sell Short (Below the G L, Below 10 R S, Dropping below 80 on the Money Wave).
Don’t Short the strong ones that are just correcting back down to the Green Lines on low Volume.
Once the Markets are Below the Green Lines, we will mainly do Inverse Funds, as most investors don’t understand Shorting…
The current Leaders should have nice pops up if they hold above the G L after this Correction, and bounce back up.
Good trading and tell your friends!
ATGL


