Above the Green Line -01
  • Market Insights
        • Commentary
          • Daily
          • Weekly
        • BUY / SELL SIGNALS
          • Trade Posts
          • Recent Trade Alerts
          • Recent Day Trades
        • BLOGROLL
          • Dividend Growth Blog
          • ETF Sector Blog
          • Dow Dogs
          • TPOW Blog
  • Strategies
        • SWING TRADING
          • Current Positions
          • Watchlists
          • Closed Positions
          • Candidates - TOP 100
          • Specialty Stocks
        • WEEKLY STOCK PICK
          • TPOW Charts
          • TPOW Performance
          • TPOW Strategy Guide
          • TPOW Performance Dashboard
        • DAY TRADING
          • Watch List
        • ATGL DASHBOARD
        • ETF STRATEGIES
          • ETF Sector Rotation
          • ETF Sector Portfolio
        • DIVIDEND GROWTH
          • Dividend Growth Portfolio
          • Dividend Calendar
        • DOGS OF THE DOW
          • Dogs of the Dow Portfolio
          • DOW 5 Portfolio
  • Markets
        • US MARKET
          • Commodities
          • Energy
          • Precious Metals
          • Volatility
        • GLOBAL MARKETS
          • Market Indices
          • Economic Calendar
          • FOREX Heat Map
          • FOREX Cross Rates
          • Crypto Currency Market
  • Investing
    • Discord Community
    • Dashboard
  • Resources
        • ARTICLES
          • Dividend Growth Model Articles
          • ETF Articles
          • Investment Strategies Articles
          • Market and Economic Insights
          • Stock Trade Articles
          • Stock Reviews
        • TOOLS
          • Stock Scanners
          • Charting Software
          • Brokerage Firms
        • STOCK CHARTS
          • Key Components
          • Reading Charts
          • Drawing Stock Charts
          • Identifying Trends
        • RETIREMENT PLANNING
  • About
    • Contact Us
    • How to Win
    • #1 At Stockcharts
    • Disclaimer
    • FAQ
  • Log In
  • Subscribe

October 27, 2019

Green Line Weekly Oct 27, 2019

SPX
What kind of Investors are Buying again up at Resistance?


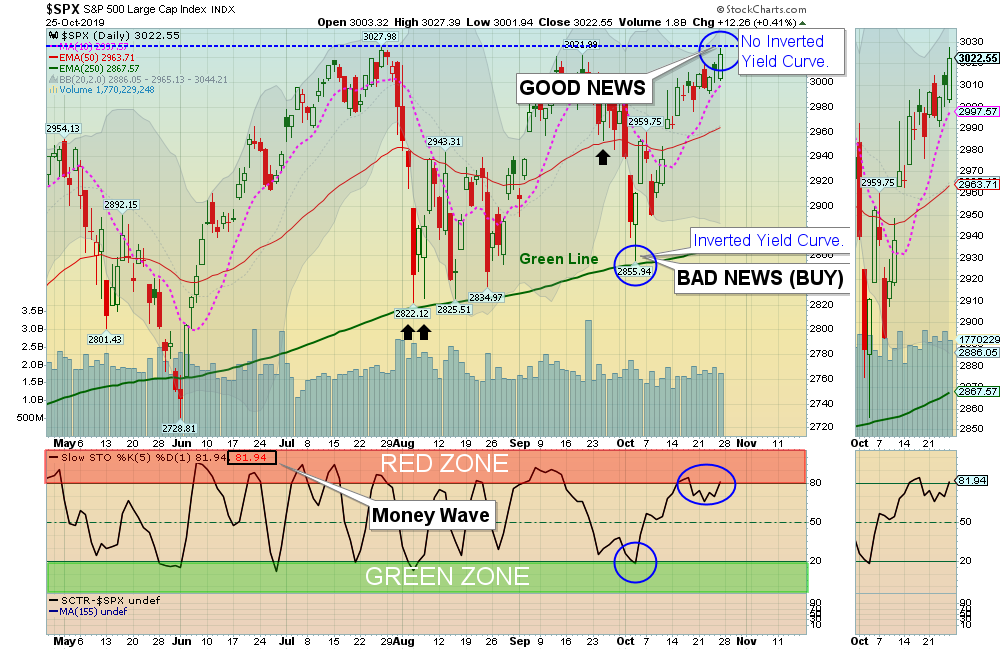
10/27/2019:  In early October the S&P 500 Index dipped down near the Green Line on Inverted Yield Curve talk (probable SlowDown coming) [BAD NEWS].  Now the Inverted Yield Curve is gone, but the S&P 500 Index is 5.8 % Higher on [GOOD NEWS] and back up at Resistance. Moral: Buy on Bad News and Sell on Good News.

Markets were up again for the week as many are hoping that the FED will lower Short Term Rates again [GOOD NEWS]. The Markets expect a 1/4 point cut, but it might be the last one, with the Markets on Highs and Unemployment on Lows. Earnings have been better than expected [GOOD NEWS].  The S&P 500 needs to exceed the July Highs of 3028 on High Volume for this rally to continue.

For the week the Dow was up 0.73%, the S&P 500 was up 1.22%, and the Nasdaq 100 was up 2.06%.  The Long Term Trend on the Stock Markets is UP. 


The Inflation Index (CRB) was up 1.49% and is Below the Green Line, indicating Economic Weakness.

Bonds  were down  0.76% for the week and are Above the Green Line, indicating Economic Weakness.

The US DOLLAR was up 0.68%, after becoming Over-Sold for the Short Term. 

Crude Oil was up 5.18% for the week at $56.66, and GOLD was up 0.75%  at $1505.30.

_____________________________________________________________________________________________

MONEY WAVE BUYS SOON:   

We are currently in 5 logged Open Positions, for the Short & Medium Term.  There are 5 Investments on the Short Term Watch List. 

Be patient and WAIT for Green Zone Buy Signals!

______________________________________________________________________________________________

LONG TERM INVESTMENTS 

Buy the Leading Investments that are down near the weekly Green Zones.     


AYX     ALTERYX INC.    Buy if it is going to Close above $98.33 on High Volume. 

NVCR    NOVOCURE LTD.    Buy if it is going to Close above $78.83.

SBUX     STARBUCKS CORP.    Buy if it is going to Close above $87.68 on High Volume.   

SNAP     SNAP INC.      Buy if it is going to Close above $15.03 on High Volume.   

SPWR     SUN POWER      Buy if it is going to Close above $10.33 on High Volume. 

TTD     TRADE DESK INC.    Buy if it is going to Close above $212.18.


___________________________________________________________________________________________

Click for  Portfolio (Open Positions)  
Click for  Watch List
Click for  Closed Positions


Alert! Market Risk is MEDIUM (Yell0w Zone). The probability of successful Short Term Trades is better, when the % of stocks above the 50-day avg. is below 20. 

Tell your Friends about the Green Line, and Help Animals

___________________________________________________________________________________________

QUESTION:   Chris writes “What is meant by “EXIT    AMZN    AMAZON.COM    if it is going to Close below your Buy Price, or $1987.15.”  Does this mean to ‘exit the position if it closes below your buy price or $1,987.15, whichever is lower OR whichever is higher?’

ANSWER:  When an Investment goes into a Money Wave Buy, it should Pop up 3-6% in a few days.  Once the Money Wave Indicator (Slow Stochastic) is > 50, and your investment is not Popping, we suggest getting out. (DON’T TAKE A LOSS.)

Maybe the Buy Signal was too early, and the Investment might go lower… This is all based on probabilities… Bet on a bounce and Bag it, or EXIT, for Short Term Trades.

We use the Closing price only to determine the Buy Price… Some subscribers might have had a slightly different entry price. EXIT if Closes LOWER than either price.

Thank you for writing!

Related Post

– Green Line Weekly Oct 20, 2019

Subscribe to Our Newsletter

AGL Logo

Get our eBook Now!

Candlestick - A Swing Traders Friend

We don’t spam! Read our privacy policy for more info.

You’ve been successfully subscribed to our newsletter!

Voted #1 at Stock Charts

SH Chart
Inverse S&P 500 Fund (SH) will have a Money Wave Buy today.

Help Us Help Animals

Help Us Help Animals

Recent Comments

  • Market Breadth Indicators: A Trader’s Guide to Early Trend Detection on Backtesting: Definition and How a Trading Strategy Backtest Works
  • Island Reversal Pattern: Definition and Formation Explained on Double Top Pattern: How to Identify and Trade This Reversal Signal
  • Channel Pattern Guide: What It Is and Why It Matters on A Guide to Forecasting Using Moving Averages
  • What Is a Broadening Bottom Chart Pattern? Full Guide on Bull vs. Bear Market: An Investor’s Guide to Market Phases
  • ATGL Weekly Money Flow - 2025-05-11 on ATGL Top Pick of the Week! Apr 6, 2025

Become a Green Liner!

Help me make more Money in the Stock Market.

ON ATGL

  • DashBoard
  • Weekly Commentary
  • Daily Buy / Sell Signals
  • Day Trade Setup
  • Trading Rooms

Design & Develop By Pixelvect

STRATEGIES

  • Swing Trading
  • ATGL Pick of the Week
  • Dividend Growth
  • ETF Sector Rotation
  • Dogs of the Dow

HELP

  • ATGL Trading Rules
  • FAQ
  • Account Maintenance
  • Contact US
  • Join

FOLLOW US

Instagram Linkedin Twitter Facebook

© COPYRIGHT 2024 · ABOVETHEGREENLINE.COM · ALL RIGHTS RESERVED · PRIVACY · TERMS · CONTACT · WATCHLIST · CURRENT