
10/20/2019: Markets were up again for the week, but weakened after getting back up near the all time Highs. Earnings are coming out and Stocks are popping up and down on the Good and Bad News. The S&P 500 is above the Red Line (50-day avg.) which is Bullish.
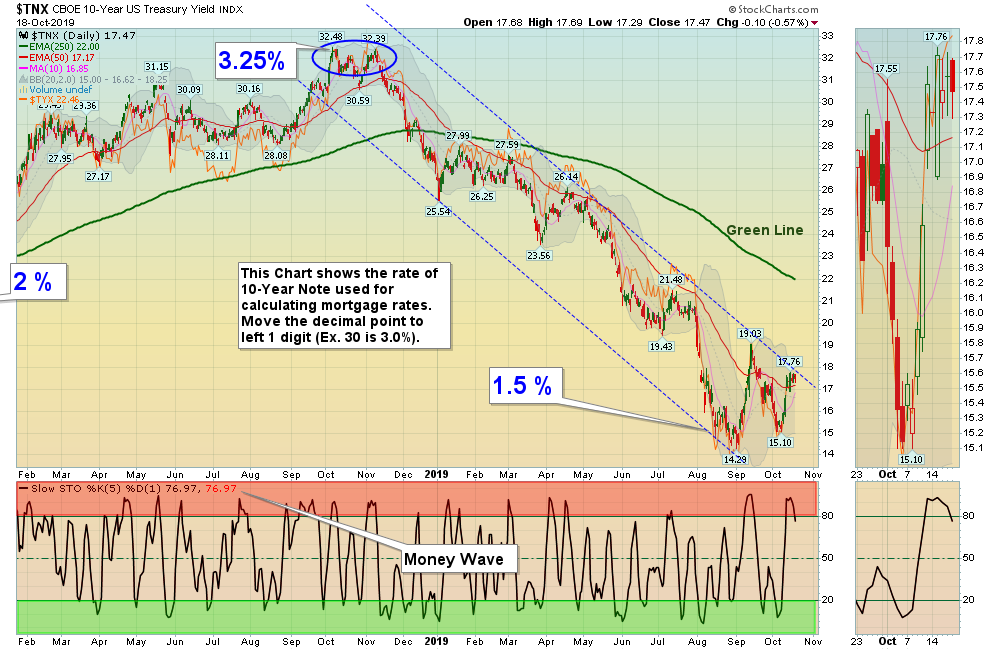
The Inverted Yield Curve which had many worried about a Recession coming, is about to fix itself. Currently the 2 Year at 1.634 % and the 10 Year Yield just slightly below at 1.623 % after falling down 1.429 % in September.
For the week the Dow was down 0.13%, the S&P 500 was up 0.58%, and the Nasdaq 100 was up 0.30%. The Long Term Trend on the Stock Markets is UP.
The Inflation Index (CRB) was down 0.16% and is Below the Green Line, indicating Economic Weakness.
Bonds were down 0.61% for the week and are Above the Green Line, indicating Economic Weakness.
The US DOLLAR was down 1.01%, a big drop after making a 3 year High recently.
Crude Oil was down 1.52% for the week at $53.97, and GOLD was up 0.36% at $1494.10.
_____________________________________________________________________________________________
MONEY WAVE BUYS SOON:
We are currently in 4 logged Open Positions, for the Short & Medium Term. There are 4 Investments on the Short Term Watch List.
Be patient and WAIT for Green Zone Buy Signals!
______________________________________________________________________________________________
LONG TERM INVESTMENTS
Buy the Leading Investments that are down near the weekly Green Zones.
AYX ALTERYX INC. Wait for the next Daily Green Zone Buy Signal.
CDNS CADENCE DESIGN Buy if it is going to Close above $67.77.
NVCR NOVOCURE LTD. Buy if it is going to Close above $78.83.
SBUX STARBUCKS CORP. Buy if it is going to Close above the Red Line of $89.11.
SPWR SUN POWER Buy if it is going to Close above the Pink Line of $9.73.
TLRA TELARIA INC. Buy if it is going to Close above the Red Line of $7.86.
TTD TRADE DESK INC. Buy if it is going to Close above $212.18.
___________________________________________________________________________________________
Click for Portfolio (Open Positions)
Click for Watch List
Click for Closed Positions
Alert! Market Risk is MEDIUM (Yell0w Zone). The probability of successful Short Term Trades is better, when the % of stocks above the 50-day avg. is below 20.
Tell your Friends about the Green Line, and Help Animals
___________________________________________________________________________________________
QUESTION: Jerry S. writes “How do I know when to Sell?”
ANSWER: Hi Jerry. Please follow the Rules for Selling below based on the Time Frame that you want to be in the Investment:
- Short Term: Sell when it Closes below the 10-day avg.
- Medium Term: Sell when it Closes below the 50-day avg.
- Long Term: Sell when it Closes below the Green Line (250-day avg).
Or Follow the PORTFOLIO (please click) on your daily emails.
Good trading, and tell your friends!


