Above the Green Line -01
  • Market Insights
        • Commentary
          • Daily
          • Weekly
        • BUY / SELL SIGNALS
          • Trade Posts
          • Recent Trade Alerts
          • Recent Day Trades
        • BLOGROLL
          • Dividend Growth Blog
          • ETF Sector Blog
          • Dow Dogs
          • TPOW Blog
  • Strategies
        • SWING TRADING
          • Current Positions
          • Watchlists
          • Closed Positions
          • Candidates - TOP 100
          • Specialty Stocks
        • WEEKLY STOCK PICK
          • TPOW Charts
          • TPOW Performance
          • TPOW Strategy Guide
          • TPOW Performance Dashboard
        • DAY TRADING
          • Watch List
        • ATGL DASHBOARD
        • ETF STRATEGIES
          • ETF Sector Rotation
          • ETF Sector Portfolio
        • DIVIDEND GROWTH
          • Dividend Growth Portfolio
          • Dividend Calendar
        • DOGS OF THE DOW
          • Dogs of the Dow Portfolio
          • DOW 5 Portfolio
  • Markets
        • US MARKET
          • Commodities
          • Energy
          • Precious Metals
          • Volatility
        • GLOBAL MARKETS
          • Market Indices
          • Economic Calendar
          • FOREX Heat Map
          • FOREX Cross Rates
          • Crypto Currency Market
  • Investing
    • Discord Community
    • Dashboard
  • Resources
        • ARTICLES
          • Dividend Growth Model Articles
          • ETF Articles
          • Investment Strategies Articles
          • Market and Economic Insights
          • Stock Trade Articles
          • Stock Reviews
        • TOOLS
          • Stock Scanners
          • Charting Software
          • Brokerage Firms
        • STOCK CHARTS
          • Key Components
          • Reading Charts
          • Drawing Stock Charts
          • Identifying Trends
        • RETIREMENT PLANNING
  • About
    • Contact Us
    • How to Win
    • #1 At Stockcharts
    • Disclaimer
    • FAQ
  • Log In
  • Subscribe

November 7, 2021

Green Line Weekly Nov 7, 2021

SPY Chart
Investor Fear quickly disappeared in just one month.

11/07/2021 Markets were higher again this week, as the major Indices were able to make New Highs on better than expected Earnings and falling Long Term Interest Rates. So with plenty more of FED Printing, most do not want to Sell. However, the Markets are currently over-bought for the Short Term, and the Buying Volume was low.

The FED did Taper on their $120 Billion of monthly DEBT Buying by $15 Billion. The Markets were expecting a larger amount of Tapering so a nice rally began. (Good News). There are plenty of Bearish Divergences (warning signs) in the Markets, but with the FED Printing there are still more Buyers than Sellers. Historically these Bearish Divergences would have lead to larger corrections, but currently most are not going to “Fight the FED”.

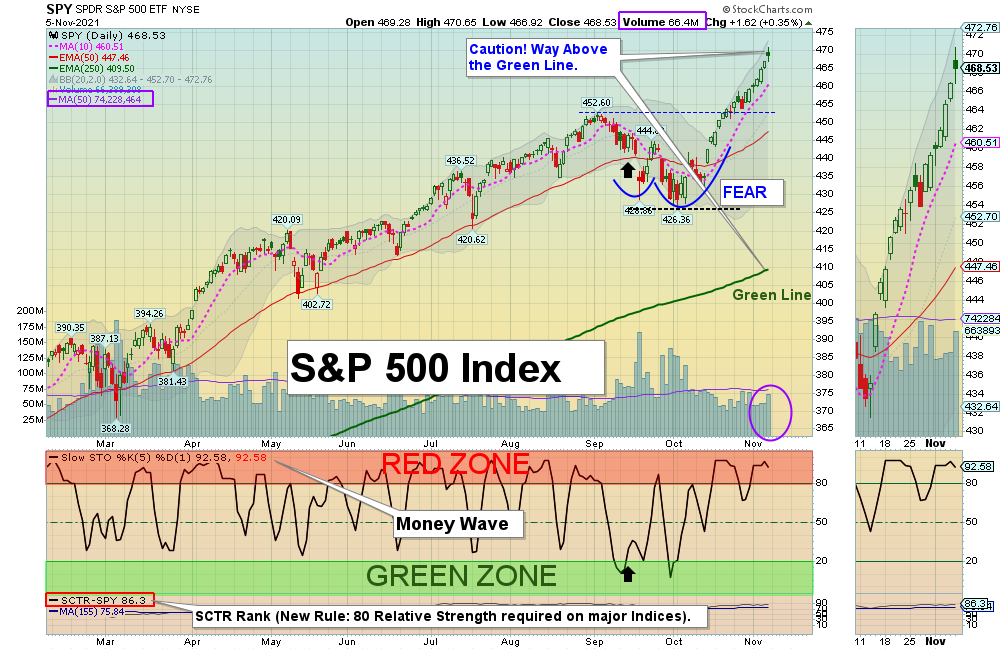
If you continue to Follow the Green Line System, your Money should flow into the Strongest areas and your account value should be able to  grow in both Bull and Bear Markets.

For the week the Dow was up 1.42%, the S&P 500 was up 2.02%, and the NASDAQ 100 was up 3.23%. The Long Term Trend for the Indices is up. 

The Inflation Index (CRB) was down 1.13% for the week and is Above the Green Line, indicating Economic Expansion.

Bonds were up 1.22% for the week, and are back Above the Green Line, indicating Economic Contraction.

The US DOLLAR was up 0.21% for the week and is Above the Green Line. 

Crude Oil was down 2.75% for the week at $81.27 and GOLD was up 1.84%  at $1816.80.

SEE SUPPLEMENTAL CHARTS

_____________________________________________________________________________________________

MONEY WAVE BUYS SOON

We are currently in only 2 logged Current Positions, for the Short & Medium Term (Most Leaders are up in the Red Zones).  There are 4 investments on the Short Term Watch List. 

Be patient and WAIT for Green Zone Buy Signals!

______________________________________________________________________________________________

LONG TERM INVESTMENTS  (most Leaders are near Highs, and most Large Caps no longer have 80 Relative Strength required.)

Long Term Scrolling Charts (Real Time)

BNTX      BIO N TECH      Wait for the next Daily Money Wave Buy Signal.

DKS      DICKS SPORTING GOODS        Wait for the next Daily Money Wave Buy Signal.

MT      ARCELOR METTAL SA      Already back up in the Weekly Red Zone. Avoid.

MRNA      MODERNA INC.      Wait for the next Daily Money Wave Buy Signal. Must also Close back above the Green Line.

YETI      YETI HOLDINGS       Up 10% this week and already Hit the $105 Target. Avoid.

______________________________________________________________________________________

My Trading Dashboard
Swing Trading Scrolling Charts
Day Trading Scrolling Charts

Click for  Watch Lists
Click for  Current Positions
Click for  Closed Positions

Updated Top 100 List Nov2 1, 2021
Dividend Growth Portfolio  
ETF Sector Rotation System      
Dogs of the DOW System
Long Term Strategy for IRAs & 401k Plans
CNN Fear & Greed Index
Scrolling Stage Chart Investing Charts

Alert! Market Risk is MEDIUM (Yellow Zone). The probability of successful Short Term Trades is better, when the % of stocks above the 50-day avg. is below 20. 

Tell your Friends about the Green Line, and Help Animals.

______________________________________________________________________________________     

4 Ways to Get your Daily Money Wave Alert:

    • Emailed to your box between 3:40 3:50 pm EST.
    • Website menu Commentary/Buy/Sell Signals
    • Twitter notifications are the fastest @AboveGreenLine
    • Text messages: Email us your Cell number & phone carrier.

Thank you,

ATGL

Related Post

– Green Line Weekly Oct 31, 2021

Subscribe to Our Newsletter

AGL Logo

Get our eBook Now!

Candlestick - A Swing Traders Friend

We don’t spam! Read our privacy policy for more info.

You’ve been successfully subscribed to our newsletter!

Voted #1 at Stock Charts

SH Chart
Inverse S&P 500 Fund (SH) will have a Money Wave Buy today.

Help Us Help Animals

Help Us Help Animals

Recent Comments

  • Market Breadth Indicators: A Trader’s Guide to Early Trend Detection on Backtesting: Definition and How a Trading Strategy Backtest Works
  • Island Reversal Pattern: Definition and Formation Explained on Double Top Pattern: How to Identify and Trade This Reversal Signal
  • Channel Pattern Guide: What It Is and Why It Matters on A Guide to Forecasting Using Moving Averages
  • What Is a Broadening Bottom Chart Pattern? Full Guide on Bull vs. Bear Market: An Investor’s Guide to Market Phases
  • ATGL Weekly Money Flow - 2025-05-11 on ATGL Top Pick of the Week! Apr 6, 2025

Become a Green Liner!

Help me make more Money in the Stock Market.

ON ATGL

  • DashBoard
  • Weekly Commentary
  • Daily Buy / Sell Signals
  • Day Trade Setup
  • Trading Rooms

Design & Develop By Pixelvect

STRATEGIES

  • Swing Trading
  • ATGL Pick of the Week
  • Dividend Growth
  • ETF Sector Rotation
  • Dogs of the Dow

HELP

  • ATGL Trading Rules
  • FAQ
  • Account Maintenance
  • Contact US
  • Join

FOLLOW US

Instagram Linkedin Twitter Facebook

© COPYRIGHT 2024 · ABOVETHEGREENLINE.COM · ALL RIGHTS RESERVED · PRIVACY · TERMS · CONTACT · WATCHLIST · CURRENT