Above the Green Line -01
  • Market Insights
        • Commentary
          • Daily
          • Weekly
        • BUY / SELL SIGNALS
          • Trade Posts
          • Recent Trade Alerts
          • Recent Day Trades
        • BLOGROLL
          • Dividend Growth Blog
          • ETF Sector Blog
          • Dow Dogs
          • TPOW Blog
  • Strategies
        • SWING TRADING
          • Current Positions
          • Watchlists
          • Closed Positions
          • Candidates - TOP 100
          • Specialty Stocks
        • WEEKLY STOCK PICK
          • TPOW Charts
          • TPOW Performance
          • TPOW Strategy Guide
          • TPOW Performance Dashboard
        • DAY TRADING
          • Watch List
        • ATGL DASHBOARD
        • ETF STRATEGIES
          • ETF Sector Rotation
          • ETF Sector Portfolio
        • DIVIDEND GROWTH
          • Dividend Growth Portfolio
          • Dividend Calendar
        • DOGS OF THE DOW
          • Dogs of the Dow Portfolio
          • DOW 5 Portfolio
  • Markets
        • US MARKET
          • Commodities
          • Energy
          • Precious Metals
          • Volatility
        • GLOBAL MARKETS
          • Market Indices
          • Economic Calendar
          • FOREX Heat Map
          • FOREX Cross Rates
          • Crypto Currency Market
  • Investing
    • Discord Community
    • Dashboard
  • Resources
        • ARTICLES
          • Dividend Growth Model Articles
          • ETF Articles
          • Investment Strategies Articles
          • Market and Economic Insights
          • Stock Trade Articles
          • Stock Reviews
        • TOOLS
          • Stock Scanners
          • Charting Software
          • Brokerage Firms
        • STOCK CHARTS
          • Key Components
          • Reading Charts
          • Drawing Stock Charts
          • Identifying Trends
        • RETIREMENT PLANNING
  • About
    • Contact Us
    • How to Win
    • #1 At Stockcharts
    • Disclaimer
    • FAQ
  • Log In
  • Subscribe

November 3, 2019

Green Line Weekly Nov 3, 2019

NASDAQ 100 Chart
35 out of the NASDAQ 100 Stocks are not Bullish. 


BUY LOW & SELL HIGH. We have all heard this, but what does Sell High mean?  High is a relative term and Investments get High or Over-Bought because of human emotions. Emotions are very difficult to measure precisely, but with Technical Analysis you can usually “Ball Park” High and Low Markets within a few weeks.  Markets become Low on lots of Bad News. Markets become High on lots of Good News. Recent Good News has been better Earnings and a Fed Cut.

When many Weekly Technical Indicators are HIGH like now, one should measure the Reward / Risk of Buying now. For example AAPL is 26.5 % Above the Green Line, and was Below the Green Line in June. For AAPL to justify a 2 : 1 Reward / Risk it needs to go up another 53 % from here. (Maybe not).

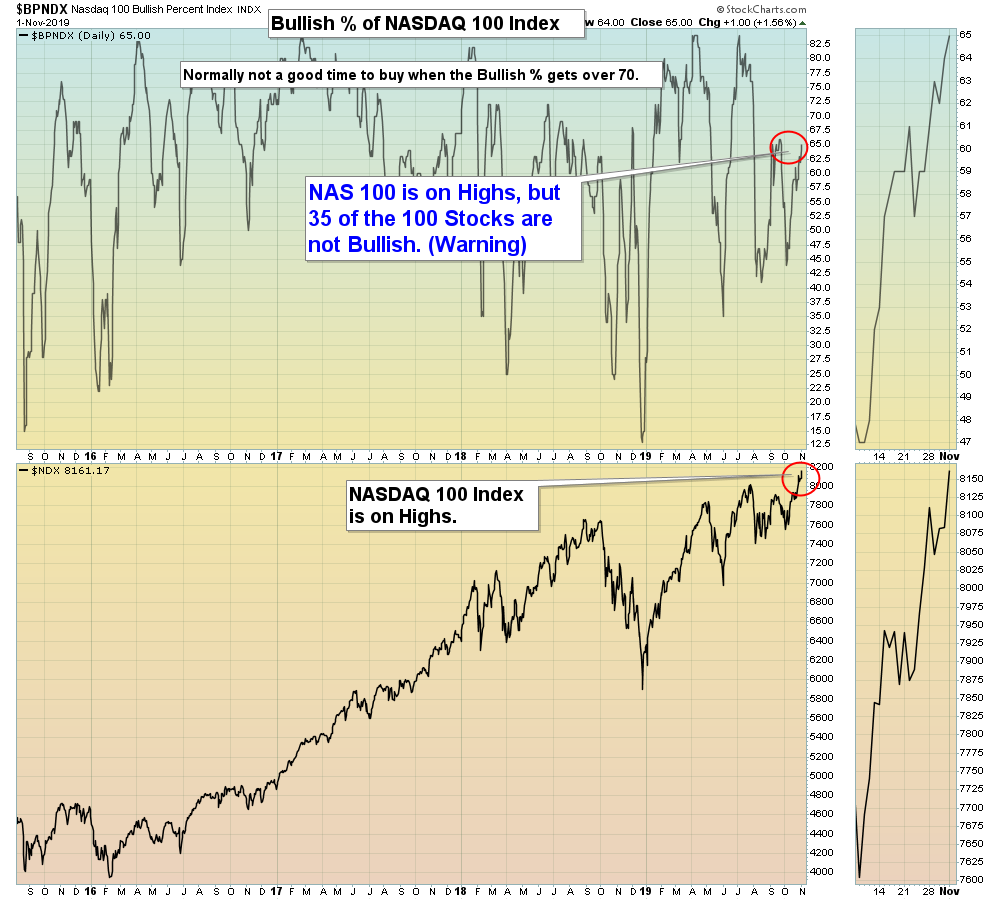
11/03/2019:  Markets were up again for the week as the FED lowered Short Term Rates again [GOOD NEWS]. This Cut might be the last one, with the Markets on Highs and Unemployment on Lows. Earnings have been better than expected [GOOD NEWS].  The S&P 500 was able to exceed the July Highs of 3028, so now 3028 should become Support.

For the week the Dow was up 1.39%, the S&P 500 was up 1.51%, and the Nasdaq 100 was up 1.65%.  The Long Term Trend on the Stock Markets is UP. 


The Inflation Index (CRB) was up 1.07% and is now slightly Above Below the Green Line, indicating Economic Strength.

Bonds  were up 1.65% for the week and are Above the Green Line, indicating Economic Weakness.

The US DOLLAR was down up 0.56%, after being hurt by the FED Cut. 

Crude Oil was down 0.81% for the week at $56.20, and GOLD was up 0.41%  at $1511.40.

_____________________________________________________________________________________________

MONEY WAVE BUYS SOON:   

We are currently in 5 logged Open Positions, for the Short & Medium Term.  There are 2 Investments on the Short Term Watch List. 

Be patient and WAIT for Green Zone Buy Signals!

______________________________________________________________________________________________

LONG TERM INVESTMENTS 

Buy the Leading Investments that are down near the weekly Green Zones.     


AYX     ALTERYX INC.    Buy if it is going to Close above $98.33 on High Volume. 

NVCR    NOVOCURE LTD.    Buy if it is going to Close above $78.83.

SBUX     STARBUCKS CORP.    Buy if it is going to Close above $87.68 on High Volume.   

SHAK     SHAKE SHACK INC.    Buy if it is going to Close above $85.50 on High Volume. 

SPWR     SUN POWER      Buy if it is going to Close above $10.33 on High Volume. 


___________________________________________________________________________________________

Click for  Portfolio (Open Positions)  
Click for  Watch List
Click for  Closed Positions


Alert! Market Risk is MEDIUM (Yell0w Zone). The probability of successful Short Term Trades is better, when the % of stocks above the 50-day avg. is below 20. 

Tell your Friends about the Green Line, and Help Animals

___________________________________________________________________________________________

QUESTION: Will writes “How do I get good in depth updates when the market changes course?”

ANSWER: Hi Will, all you need to do is follow 2 Charts.

  1. First Chart:   Buy the Markets for the Short Term in the Green Zone and take profits in the Red Zone. Click Link here.
  1. Second Chart:   Buy the Markets for the Longer Term in the Green Zone. Click Link here.

Related Post

– Green Line Weekly Oct 27, 2019

Subscribe to Our Newsletter

AGL Logo

Get our eBook Now!

Candlestick - A Swing Traders Friend

We don’t spam! Read our privacy policy for more info.

You’ve been successfully subscribed to our newsletter!

Voted #1 at Stock Charts

SH Chart
Inverse S&P 500 Fund (SH) will have a Money Wave Buy today.

Help Us Help Animals

Help Us Help Animals

Recent Comments

  • Market Breadth Indicators: A Trader’s Guide to Early Trend Detection on Backtesting: Definition and How a Trading Strategy Backtest Works
  • Island Reversal Pattern: Definition and Formation Explained on Double Top Pattern: How to Identify and Trade This Reversal Signal
  • Channel Pattern Guide: What It Is and Why It Matters on A Guide to Forecasting Using Moving Averages
  • What Is a Broadening Bottom Chart Pattern? Full Guide on Bull vs. Bear Market: An Investor’s Guide to Market Phases
  • ATGL Weekly Money Flow - 2025-05-11 on ATGL Top Pick of the Week! Apr 6, 2025

Become a Green Liner!

Help me make more Money in the Stock Market.

ON ATGL

  • DashBoard
  • Weekly Commentary
  • Daily Buy / Sell Signals
  • Day Trade Setup
  • Trading Rooms

Design & Develop By Pixelvect

STRATEGIES

  • Swing Trading
  • ATGL Pick of the Week
  • Dividend Growth
  • ETF Sector Rotation
  • Dogs of the Dow

HELP

  • ATGL Trading Rules
  • FAQ
  • Account Maintenance
  • Contact US
  • Join

FOLLOW US

Instagram Linkedin Twitter Facebook

© COPYRIGHT 2024 · ABOVETHEGREENLINE.COM · ALL RIGHTS RESERVED · PRIVACY · TERMS · CONTACT · WATCHLIST · CURRENT