
11/28/2021 Markets were down for the week, as the major Indices were stretched Way Above the Green Lines. The strongest S&P 500 and NASDAQ 100 Indices are holding up just fine by staying above the Red Lines (50-day avgs.) The weaker DOW 30, NYSE, and Small Cap Indices dumped below the Red Lines, as the broad Indices could not be held up by propping up the 10 largest Stocks. Now is the time to try to own only the Strongest Investments, those that are still Above the Red Lines. That list has really narrowed, as 47% of the S&P 500 Stocks are currently Below the Red Lines
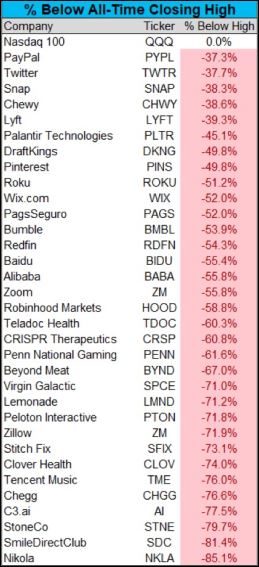
The high Volume Leaders that are holding up well are: QQQ XLK XLY ITB SPY SMH AAPL AMD BX F HPQ LAC M MSFT NVDA PFE QCOM & TSLA. These should bounce back up soon to re-test the recent Highs. Many Darling Stocks from last year have really sold off (see Chart above) and no longer meet the Green Line Rules.
If you continue to Follow the Green Line System, your Money should flow into the Strongest areas and your account value should be able to grow in both Bull and Bear Markets.
There has been plenty of action on the Day Trading Scrolling Charts.
NEW! DAY TRADING FOR INDICES & LARGE CAPS.
For the week the Dow was down 1.94%, the S&P 500 was down 2.12%, and the NASDAQ 100 was down 3.17%. The Long Term Trend for the Indices is up.
The Inflation Index (CRB) was down 3.53% for the week and is Above the Green Line, indicating Economic Expansion.
Bonds were up 1.46% for the week, and are back Above the Green Line, indicating Economic Contraction.
The US DOLLAR was up 0.08% for the week and is Above the Green Line.
Crude Oil was down 10.26% for the week at $68.15 and GOLD was down 3.57% at $1785.50.
_____________________________________________________________________________________________
MONEY WAVE BUYS SOON
We are currently in 4 logged Current Positions, for the Short & Medium Term (Most Leaders are coming down from the Red Zones). There are 4 investments on the Short Term Watch List.
Be patient and WAIT for Green Zone Buy Signals!
______________________________________________________________________________________________
LONG TERM INVESTMENTS (many Leaders are near Highs, and many Large Caps no longer have 80 Relative Strength required.)
Long Term Scrolling Charts (Real Time)
BCRX BIOCRYST PHARMA. Buy if it Closes above $13.27 with High Volume.
BNTX BIO N TECH Up another 20 % this week. We missed it. Avoid.
BTU PEABODY ENERY CORP. Buy if it Closes above $12.17 with High Volume.
COF CAPITAL ONE FINANCIAL Wait for the next Daily Money Wave Buy Signal with High Volume.
MRNA MODERNA INC. Up another 25 % this week. Avoid.
RSX RUSSIA FUND Wait for the next Daily Money Wave Buy Signal with High Volume. Must be back above the Green Line.
SB SAFE BULKERS INC. Buy if it Closes above $3.68 with High Volume.
______________________________________________________________________________________
My Trading Dashboard
Swing Trading Scrolling Charts
Day Trading Scrolling Charts
Click for Watch Lists
Click for Current Positions
Click for Closed Positions
Updated Top 100 List Nov 2, 2021
Dividend Growth Portfolio
ETF Sector Rotation System
Dogs of the DOW System
Long Term Strategy for IRAs & 401k Plans
CNN Fear & Greed Index
Scrolling Stage Chart Investing Charts
Alert! Market Risk is HIGH (Red Zone). The probability of successful Short Term Trades is better, when the % of stocks above the 50-day avg. is below 20.
Tell your Friends about the Green Line, and Help Animals.
______________________________________________________________________________________
A considerate comment from Duanega:
Your web site is outstanding! You are correct, when you say, if you want to make money in stocks, Follow Above the Green Line, especially when you see a Triple Buy Signal.
Plus I went on my computer and saw how you have expanded so much in the last year. I have been following you for 4 years, and the last 6 months I have followed quite a few trades and done extremely well!!
Thanks, Duanega.