
11/21/2021 Markets were mixed for the week, as the major Indices are still stretched Way Above the Green Lines. The Big Tech were higher as most of the Money has been flowing into the 10 largest Stocks. These 10 Stocks account for about 18% of the value of the 500 Stocks in the S&P 500 Index (normally they would account for 2% of the value). If you own many normal Stocks, you have seen that many of them are well off the Highs. Actually 38% of the S&P 500 Stocks are Below their 50-day averages, which is not good historically if the S&P 500 is near Highs.
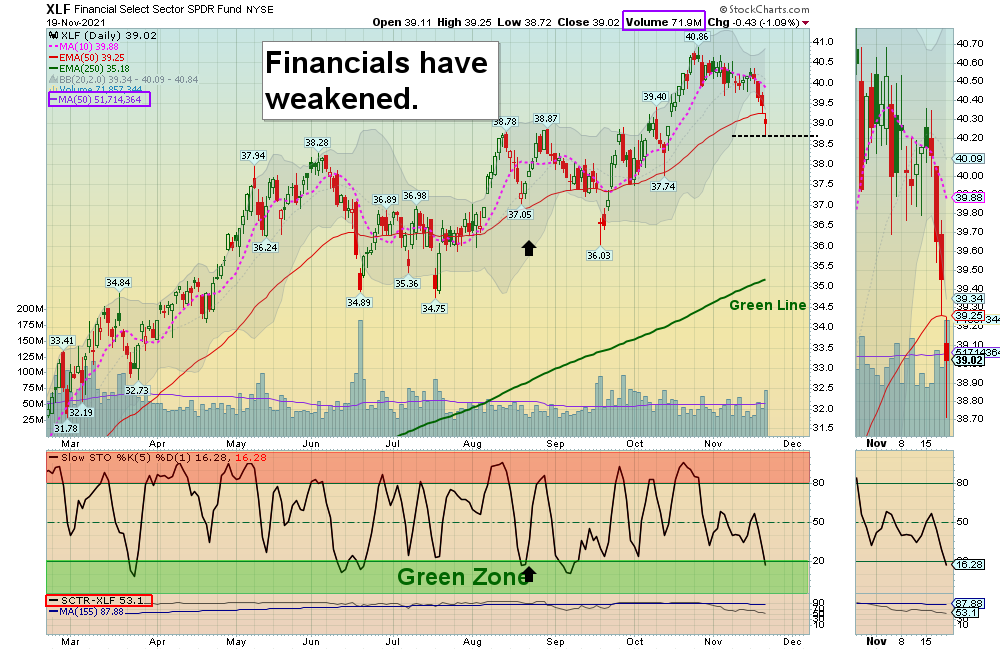
The Media has convinced most Investors that all is well, but Bonds and Financials are suggesting that things could be slowing down from Supply Chain or Virus Lockdowns. Some companies are starting to warn about slowing growth prospects, but we will be ready with Cash to Buy the Leaders when they are on Sale.
If you continue to Follow the Green Line System, your Money should flow into the Strongest areas and your account value should be able to grow in both Bull and Bear Markets.
There has been plenty of action on the Day Trading Scrolling Charts.
For the week the Dow was down 1.29%, the S&P 500 was up 0.35%, and the NASDAQ 100 was up 2.35%. The Long Term Trend for the Indices is up.
The Inflation Index (CRB) was down 0.87% for the week and is Above the Green Line, indicating Economic Expansion.
Bonds were up 0.70% for the week, and are back Above the Green Line, indicating Economic Contraction.
The US DOLLAR was up 0.95% for the week and is Above the Green Line.
Crude Oil was down 6.00% for the week at $75.94 and GOLD was down 0.90% at $1851.60.
_____________________________________________________________________________________________
MONEY WAVE BUYS SOON
We are currently in 3 logged Current Positions, for the Short & Medium Term (Most Leaders are up near the Red Zones). There are 6 investments on the Short Term Watch List.
Be patient and WAIT for Green Zone Buy Signals!
______________________________________________________________________________________________
LONG TERM INVESTMENTS (many Leaders are near Highs, and most Large Caps no longer have 80 Relative Strength required.)
Long Term Scrolling Charts (Real Time)
BNTX BIO N TECH Shot up 21.67 % this week. Wait for the next Daily Money Wave Buy Signal. Might have missed it.
BTU PEABODY ENERY CORP. Wait for the next Daily Money Wave Buy Signal with High Volume.
COF CAPITAL ONE FINANCIAL Trying to go into a Daily Money Wave Buy Signal on Friday. Good to go on Monday if Volume is High.
MRNA MODERNA INC. Up 14 % this week and is back Above the Green Line. Wait for the next Daily Money Wave Buy Signal.
RSX RUSSIA FUND Wait for the next Daily Money Wave Buy Signal with High Volume.
SB SAFE BULKERS INC. Wait for the next Daily Money Wave Buy Signal with High Volume.
______________________________________________________________________________________
My Trading Dashboard
Swing Trading Scrolling Charts
Day Trading Scrolling Charts
Click for Watch Lists
Click for Current Positions
Click for Closed Positions
Updated Top 100 List Nov 2, 2021
Dividend Growth Portfolio
ETF Sector Rotation System
Dogs of the DOW System
Long Term Strategy for IRAs & 401k Plans
CNN Fear & Greed Index
Scrolling Stage Chart Investing Charts
Alert! Market Risk is HIGH (Red Zone). The probability of successful Short Term Trades is better, when the % of stocks above the 50-day avg. is below 20.
Tell your Friends about the Green Line, and Help Animals.
______________________________________________________________________________________
QUESTION: Winter writes ““Don’t take a Loss” confuses me. What does that mean?”
ANSWER: When the Investment has a Money Wave Buy Signal, it should pop up 3-6 % in just a few days.
If it is not popping up well, and the Money Wave > 50, either Get the H out, or Don’t Take a Loss! (Get Out Even).
Something must be Wrong. There will be plenty more Money Wave Signals soon… Raise Cash, and don’t get Stuck! Wait for the next one.
Good trading and tell your friends!
ATGL


