
11/27/2022 Markets were higher for the week on a slow Holiday week. The DOW 30 Index is now well Above the Green Line, but the other major Indices have stalled at or Below the Green Lines. Now the Markets need the FED to stop tightening (raising short term Interest Rates) to go much higher.
Many expect the FED to raise the FED Funds rate another 1/2 point at the next FED Meeting on Dec 14th. This week the FED started talking about Inflation possibly slowing, and the FED could be winding down on the tightening (which is what the Markets are waiting for).
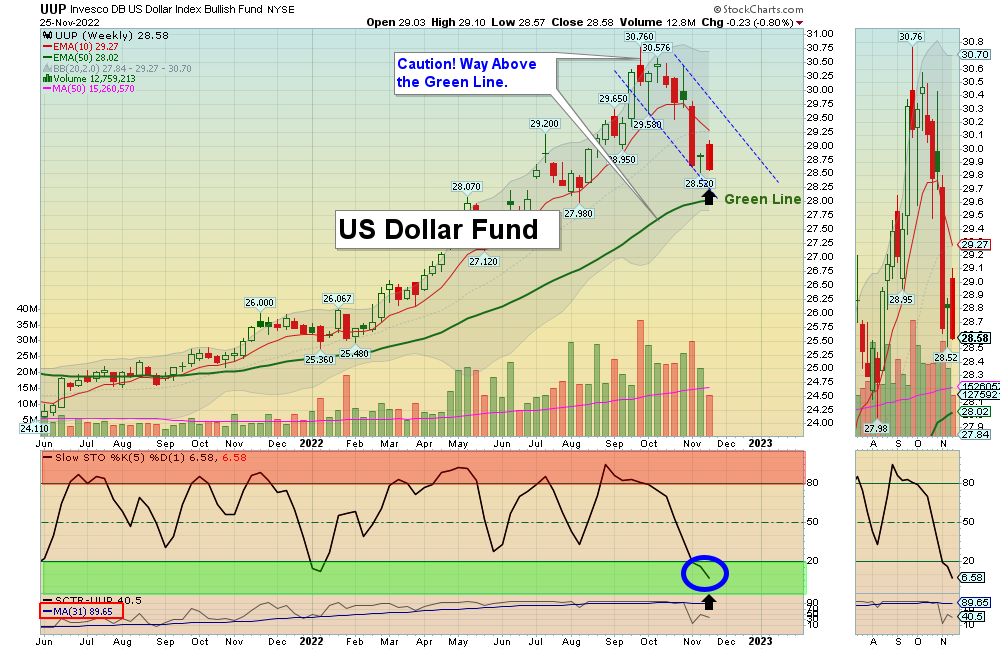
The US Dollar and long term Interest Rates have come down, as the Economy has weakened from FED Tightening. But the Dollar and long term Interest Rates should have enough upward momentum to go back up and re-test the recent highs again (UUP & TBT Buys soon). Don’t be surprised if the Media creates another FEAR cycle, causing Stocks to pull back and the Leaders will return back down into the Green Zones for Money Wave Buys again.
If you continue to Follow the Green Line System, your Money should flow into the Strongest areas and your account value should be able to grow in both Bull and Bear Markets.
________________________________________________________________________________________________________________________________________________
For the week the Dow was up 1.82%, the S&P 500 was up 1.59% and the NASDAQ 100 was up 0.74%. Most of the major Indices are still Below the Green Lines, so you should currently own the stronger Securities here.
The Inflation Index (CRB) was up 0.17% for the week and is Above the Green Line, indicating Economic Expansion.
Bonds were up 3.27 % for the week, and are Below the Green Line, indicating Economic Expansion.
The US DOLLAR was down 0.85% for the week and is Above the Green Line.
Crude Oil was down 4.78% for the week at $76.28 and GOLD was down 0.02% at $1754.00.
More action this week on the Day Trading Scrolling Charts.
DAY TRADING CHARTS FOR INDICES & LARGE CAPS.
We have not had many intra-day Trade Alert signals lately as the Volume has been too Low with the Buy Signals. These low Volume Buy Signals tend to pop up and quickly fade back down. We like to see High Volume on rallies.
_____________________________________________________________________________________________
MONEY WAVE BUYS SOON:
We are in now in 5 logged Current Positions for the Short & Medium Term. There are 5 investments on the Short Term Watch List.
Be patient and WAIT for Green Zone Buy Signals!
LONG TERM INVESTMENTS: (Hard to find many Long Term now because most normal Investments no longer have 80 Relative Strength required.)
Long Term Scrolling Charts (Real Time)
AVXL ANAVEX LIFE SCIENCES Wait for the next Daily Money Wave Buy Signal.
BLU BELLUS HEALTH Buy if it Closes above $9.84 with High Volume.
CROX CROX INC. Wait for the next Daily Money Wave Buy Signal.
PBR PETROBAS ENERGY Wait for the next Weekly Money Wave Buy Signal.
PDD PINDUODUO INC. Buy if it Closes above $73.02 with High Volume. (now in Stage 1 Base).
SIGA SIGA TECH. Wait for Close back Above the Green Line.
UUP US DOLLAR FUND Wait for the next Weekly Money Wave Buy Signal.
VIPS VIPSHOP HOLDINGS Buy if it Closes above $13.32 with High Volume. (now in Stage 1 Base).
______________________________________________________________________________________________________
My Trading Dashboard
Swing Trading Scrolling Charts
Day Trading Scrolling Charts
Click for Watch Lists
Click for Current Positions
Click for Closed Positions
Updated Top 100 List Nov 1, 2022
Dividend Growth Portfolio
Updated ETF Sector Rotation System
Dogs of the DOW System
Long Term Strategy for IRAs & 401k Plans
CNN Fear & Greed Index
Scrolling Stage Chart Investing Charts
Alert! Market Risk is High (RED). The probability of successful Short Term Trades is better, when the % of stocks above the 50-day avg. is below 20.
Tell your Friends about the Green Line, and Help Animals.
________________________________________________________________________________
QUESTION: John C. writes “Hi. I have been using your methods with quite good success over the past year, but lately I have been wondering something. Sometimes you post a daily chart for a company, but other times you post a weekly chart. For swing/momentum trading, which chart is best to go by, because looking at both, side to side, the Money Waves are quite different.
Many thanks, John C.
ANSWER: Hi John. The Green Line System is based on Buying the Leaders in the Green Zone, and taking Profits in the Red Zone.
The Daily Chart cycle (Green Zone to Red Zone) usually takes 1-3 weeks and the Weekly Chart takes 1-3 months. If you Buy the Weekly, don’t look at the Daily, as the Daily will cycle thru many times and be confusing. Pick only one Time Frame, and stick with it.
Many will use a shorter term Time Frame for ENTRY only, then go back to your Main Chart decision.
Thanks for writing.
ATGL
Related Post
– AVXL


