Above the Green Line -01
  • Market Insights
        • Commentary
          • Daily
          • Weekly
        • BUY / SELL SIGNALS
          • Trade Posts
          • Recent Trade Alerts
          • Recent Day Trades
        • BLOGROLL
          • Dividend Growth Blog
          • ETF Sector Blog
          • Dow Dogs
          • TPOW Blog
  • Strategies
        • SWING TRADING
          • Current Positions
          • Watchlists
          • Closed Positions
          • Candidates - TOP 100
          • Specialty Stocks
        • WEEKLY STOCK PICK
          • TPOW Charts
          • TPOW Performance
          • TPOW Strategy Guide
          • TPOW Performance Dashboard
        • DAY TRADING
          • Watch List
        • ATGL DASHBOARD
        • ETF STRATEGIES
          • ETF Sector Rotation
          • ETF Sector Portfolio
        • DIVIDEND GROWTH
          • Dividend Growth Portfolio
          • Dividend Calendar
        • DOGS OF THE DOW
          • Dogs of the Dow Portfolio
          • DOW 5 Portfolio
  • Markets
        • US MARKET
          • Commodities
          • Energy
          • Precious Metals
          • Volatility
        • GLOBAL MARKETS
          • Market Indices
          • Economic Calendar
          • FOREX Heat Map
          • FOREX Cross Rates
          • Crypto Currency Market
  • Investing
    • Discord Community
    • Dashboard
  • Resources
        • ARTICLES
          • Dividend Growth Model Articles
          • ETF Articles
          • Investment Strategies Articles
          • Market and Economic Insights
          • Stock Trade Articles
          • Stock Reviews
        • TOOLS
          • Stock Scanners
          • Charting Software
          • Brokerage Firms
        • STOCK CHARTS
          • Key Components
          • Reading Charts
          • Drawing Stock Charts
          • Identifying Trends
        • RETIREMENT PLANNING
  • About
    • Contact Us
    • How to Win
    • #1 At Stockcharts
    • Disclaimer
    • FAQ
  • Log In
  • Subscribe

November 25, 2018

Green Line Weekly Nov 25, 2018

SPX Weekly
S&P 500 Index is down near Support around 2600.


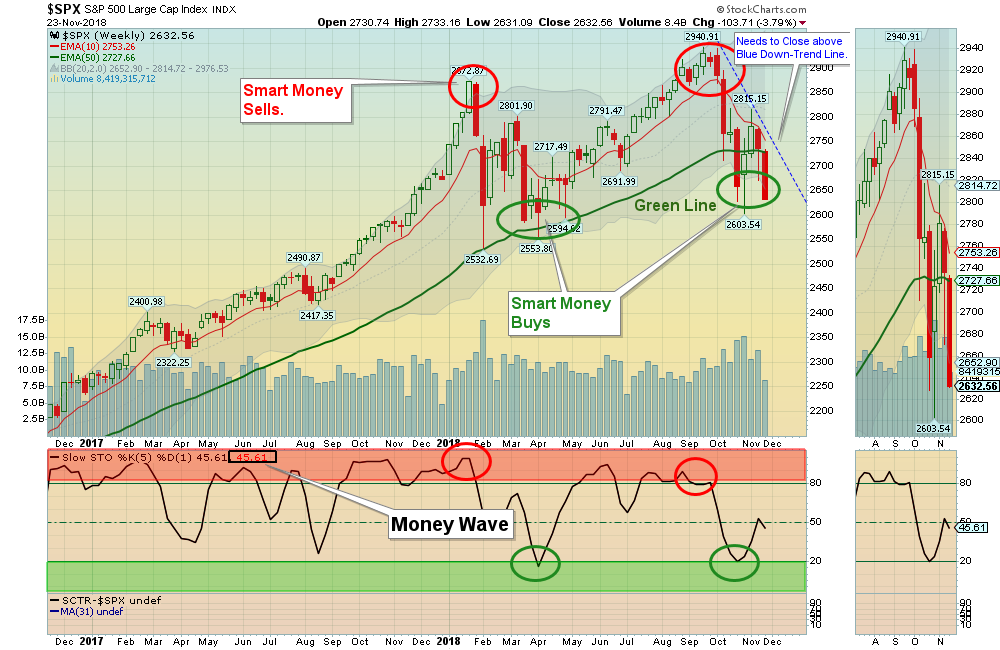
11/25/2018:  Last Quarter Great Earnings came out and the HERD bought Stocks Way Above the Green Line on the Good News. Smart Money took profits on the Good News. Now the HERD is Selling as they are finally seeing that the Economy is slowing down (Bad News). Smart Money is waiting to get back into the over-sold Markets if they hold near Support on Bad News.

Probably some Good News coming soon like Not Raising Rates in Dec. by the FED, or a China Trade Agreement (so the Herd can Buy back in).

Markets were down for the week, as the Indexes are going back down to re-test the October Lows. The Strongest Leaders that are holding Above the Green Line should go back up to re-test the September Highs (see Long Term List below).

Investments that are struggling Below the Green Line should probably be Sold on the next rally.

For the week the Dow was down 4.44%, the S&P 500 was down 3.83%, and the Nasdaq 100 was down 4.95%.   The Long Term Trend on the Stock Markets is UP.


The Inflation Index (CRB) was down 4.11% and is Below the Green Line, indicating Economic Weakness.

Bonds  were up  0.38% for the week and are Below the Green Line, indicating Economic Strength.

The US DOLLAR  was up 0.62%, and is currently over-bought.

Crude Oil was down 11.04% for the week at $50.42, and GOLD was unchanged at $1223.

___________________________________________________________________________________________

MONEY WAVE BUYS SOON:   

We are currently in 7 logged Open Positions, for the Short & Medium Term.  There are 5 Investments on the Short Term Watch List. 

Be patient and WAIT for Green Zone Buy Signals!

______________________________________________________________________________________________

LONG TERM TRADES 

The Long Term List has become large, and if the Investments below can Bounce up off the Green Line with Above 80 Relative Strength, some could re-test their Highs.

   
ADBE    ADOBE SYSTEMS    Wait for weekly Close Above the Red Line of $244.31 (50-day avg.)   
ARWR    ARROWHEAD PHARMA.     Wait for weekly Close Above the Red Line of $14.23 (50-day avg.)      
CVNA   CARVANA CO.    Wait for weekly Close Above the Red Line of $47.30 (50-day avg.)         
FOSL    FOSSIL GROUP    Place Buy Stop Order above $24.28 on the Close.   
FTNT    FORTINET INC.    Wait for weekly Close Above the Red Line of $76.04 (50-day avg.)     
LULU    LULULEMON ATHLETICA     Wait for weekly Close Above the Red Line of $136.94 (50-day avg.) 
OKTA    OKTA, INC.    Wait for weekly Close Above the Red Line of $57.87 (50-day avg.)   
QQQ    NASDAQ 100 Fund    Wait for weekly Close Above the Red Line of $170.78 (50-day avg.)    
RUN    SUNRUN, INC    Place Buy Stop Order above $13.50 on the Close.   
URBN    URBAN OUTFITTERS    Place Buy Stop Order above $41.77 on the Close. 
WWE    WORLD WRESTLING    Wait for weekly Close Above the Red Line of $73.59 (50-day avg.) 

___________________________________________________________________________________________


Click for  Portfolio (Open Positions)  
Click for  Watch List
Click for  Closed Positions


Alert! Market Risk is MEDIUM (Yellow Zone). The probability of successful Short Term Trades is better, when the S&P 500 is down near the Green Line. 

Tell your Friends about the Green Line, and Help Animals.


4 Ways to Get your Daily Money Wave Alert:

  • Emailed to your box between 3:30 3:50pm EST.
  • Website menu Commentary/Buy/Sell Signals
  • Twitter notifications @AboveGreenLine
  • Text messages: Email us your Cell number & phone carrier.

Related Post

– Green Line Weekly Nov 18, 2018

Subscribe to Our Newsletter

AGL Logo

Get our eBook Now!

Candlestick - A Swing Traders Friend

We don’t spam! Read our privacy policy for more info.

You’ve been successfully subscribed to our newsletter!

Voted #1 at Stock Charts

SH Chart
Inverse S&P 500 Fund (SH) will have a Money Wave Buy today.

Help Us Help Animals

Help Us Help Animals

Recent Comments

  • Market Breadth Indicators: A Trader’s Guide to Early Trend Detection on Backtesting: Definition and How a Trading Strategy Backtest Works
  • Island Reversal Pattern: Definition and Formation Explained on Double Top Pattern: How to Identify and Trade This Reversal Signal
  • Channel Pattern Guide: What It Is and Why It Matters on A Guide to Forecasting Using Moving Averages
  • What Is a Broadening Bottom Chart Pattern? Full Guide on Bull vs. Bear Market: An Investor’s Guide to Market Phases
  • ATGL Weekly Money Flow - 2025-05-11 on ATGL Top Pick of the Week! Apr 6, 2025

Become a Green Liner!

Help me make more Money in the Stock Market.

ON ATGL

  • DashBoard
  • Weekly Commentary
  • Daily Buy / Sell Signals
  • Day Trade Setup
  • Trading Rooms

Design & Develop By Pixelvect

STRATEGIES

  • Swing Trading
  • ATGL Pick of the Week
  • Dividend Growth
  • ETF Sector Rotation
  • Dogs of the Dow

HELP

  • ATGL Trading Rules
  • FAQ
  • Account Maintenance
  • Contact US
  • Join

FOLLOW US

Instagram Linkedin Twitter Facebook

© COPYRIGHT 2024 · ABOVETHEGREENLINE.COM · ALL RIGHTS RESERVED · PRIVACY · TERMS · CONTACT · WATCHLIST · CURRENT