
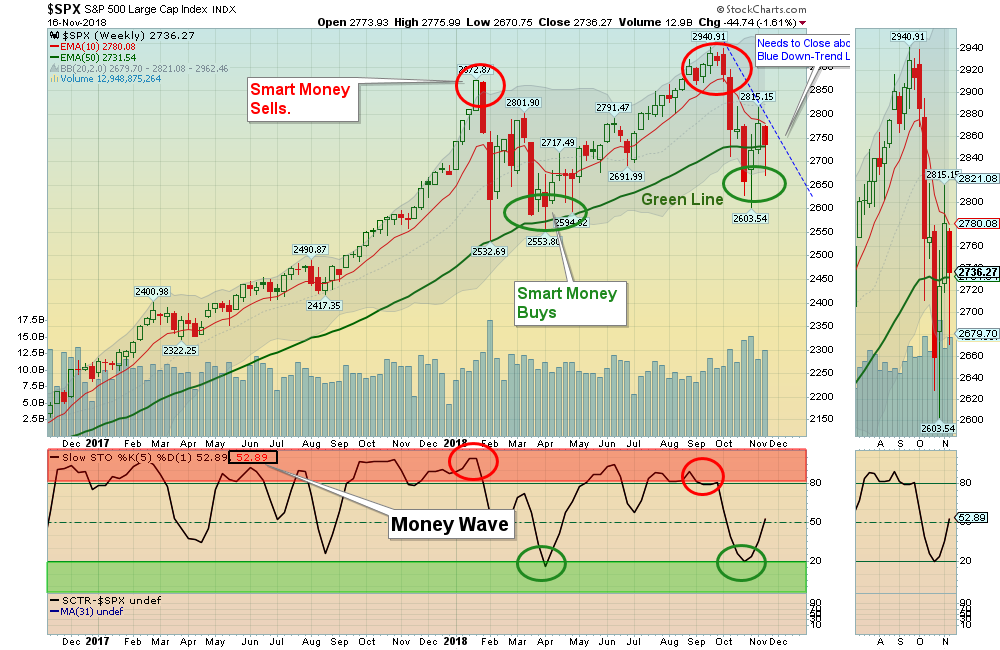
11/18/2018: Markets were down for the week, as the Indexes were over-bought on the Short Term. The Markets are going back down to re-test the recent Lows. So far the Selling has been much weaker this time down, and the Strongest Leaders that are holding Above the Green Line + Above 90 Relative Strength should go back up to re-test the September Highs.
Investments that are struggling Below the Green Line should probably be Sold on the next rally.
Money does not seem to be leaving the Markets, just rotating into Defensive Investments like XLP Consumer Staple Fund and XLU Utility Fund.
For the week the Dow was down 2.22%, the S&P 500 was down 1.45%, and the Nasdaq 100 was down 2.45%. The Long Term Trend on the Stock Markets is UP.
The Inflation Index (CRB) was down 1.15% and is Below the Green Line, indicating Economic Weakness.
Bonds were up 1.19% for the week and are Below the Green Line, indicating Economic Strength.
The US DOLLAR was down 0.31%, and is currently over-bought.
Crude Oil was down 5.83% for the week at $56.68, and GOLD was up at $1223.
___________________________________________________________________________________________
MONEY WAVE BUYS SOON:
We are currently in 9 logged Open Positions, for the Short & Medium Term. There are 5 Investments on the Short Term Watch List.
Be patient and WAIT for Green Zone Buy Signals!
______________________________________________________________________________________________
LONG TERM TRADES
The Long Term List has become large, and if the Investments below can Bounce up off the Green Line with Above 80 Relative Strength, some could re-test their Highs.
AAPL APPLE INC. Wait for weekly Close Above the Red Line of $209.60 (50-day avg.)
ADBE ADOBE SYSTEMS Wait for weekly Close Above the Red Line of $248.48 (50-day avg.)
ARWR ARROWHEAD PHARMA. Wait for weekly Close Above the Red Line of $14.50 (50-day avg.)
CRM SALESFORCE.COM Wait for weekly Close Above the Red Line of $140.40 (50-day avg.)
CVNA CARVANA CO. Wait for weekly Close Above the Red Line of $48.33 (50-day avg.)
FDN INTERNET FUND Wait for weekly Close Above the Red Line of $129.99 (50-day avg.)
FOSL FOSSIL GROUP Place Buy Stop Order above $24.28 on the Close.
FTNT FORTINET INC. Wait for weekly Close Above the Red Line of $77.83 (50-day avg.)
OKTA OKTA, INC. Wait for weekly Close Above the Red Line of $59.17 (50-day avg.)
QQQ NASDAQ 100 Fund Wait for weekly Close Above the Red Line of $173.35 (50-day avg.)
URBN URBAN OUTFITTERS Place Buy Stop Order above $41.77 on the Close.
WWE WORLD WRESTLING Wait for weekly Close Above the Red Line of $76.04 (50-day avg.)
___________________________________________________________________________________________
Click for Portfolio (Open Positions)
Click for Watch List
Click for Closed Positions
Alert! Market Risk is MEDIUM (Yellow Zone). The probability of successful Short Term Trades is better, when the S&P 500 is down near the Green Line.
Tell your Friends about the Green Line, and Help Animals.
QUESTION: Jim writes “Hi there, I am a member but am still confused on how best to react to these emails. Thanks.”
ANSWER: Hi Jim!
The Green Line System Buys High Volume & High Relative Strength Investments when they pull-back (Into the Green Zone).
Investments that are in the Green Zone (or On Deck) are on the Watch List. for you to Study.
When the Investment has a Buy Signal (Money Wave Closing above the Green Zone, we send out an email or text before the Mkt. Close.
Then Buy the Investment, and put in the Sell Stop Loss (Stop is based on Closing price)… Then Monitor the PORTFOLIO Page to update your Stop Loss, or wait for Email to Sell.
It is that Simple!
Good trading, and tell your friends!


