Above the Green Line -01
  • Market Insights
        • Commentary
          • Daily
          • Weekly
        • BUY / SELL SIGNALS
          • Trade Posts
          • Recent Trade Alerts
          • Recent Day Trades
        • BLOGROLL
          • Dividend Growth Blog
          • ETF Sector Blog
          • Dow Dogs
          • TPOW Blog
  • Strategies
        • SWING TRADING
          • Current Positions
          • Watchlists
          • Closed Positions
          • Candidates - TOP 100
          • Specialty Stocks
        • WEEKLY STOCK PICK
          • TPOW Charts
          • TPOW Performance
          • TPOW Strategy Guide
          • TPOW Performance Dashboard
        • DAY TRADING
          • Watch List
        • ATGL DASHBOARD
        • ETF STRATEGIES
          • ETF Sector Rotation
          • ETF Sector Portfolio
        • DIVIDEND GROWTH
          • Dividend Growth Portfolio
          • Dividend Calendar
        • DOGS OF THE DOW
          • Dogs of the Dow Portfolio
          • DOW 5 Portfolio
  • Markets
        • US MARKET
          • Commodities
          • Energy
          • Precious Metals
          • Volatility
        • GLOBAL MARKETS
          • Market Indices
          • Economic Calendar
          • FOREX Heat Map
          • FOREX Cross Rates
          • Crypto Currency Market
  • Investing
    • Discord Community
    • Dashboard
  • Resources
        • ARTICLES
          • Dividend Growth Model Articles
          • ETF Articles
          • Investment Strategies Articles
          • Market and Economic Insights
          • Stock Trade Articles
          • Stock Reviews
        • TOOLS
          • Stock Scanners
          • Charting Software
          • Brokerage Firms
        • STOCK CHARTS
          • Key Components
          • Reading Charts
          • Drawing Stock Charts
          • Identifying Trends
        • RETIREMENT PLANNING
  • About
    • Contact Us
    • How to Win
    • #1 At Stockcharts
    • Disclaimer
    • FAQ
  • Log In
  • Subscribe

November 22, 2020

Green Line Weekly Nov 22, 2020

SMH Chart
Markets are betting the Virus will be over soon.

11/22/2020 Markets were mostly lower for the week as the major Indices are back up near the Highs (Resistance).  Profit taking has been coming in near the Highs. The Markets have been running up on Good News about Low Interest Rates, favorable Virus Vaccine news, and better than expected Earnings.  Probably the only Good News left for the Short Term would be another Stimulus Plan. 

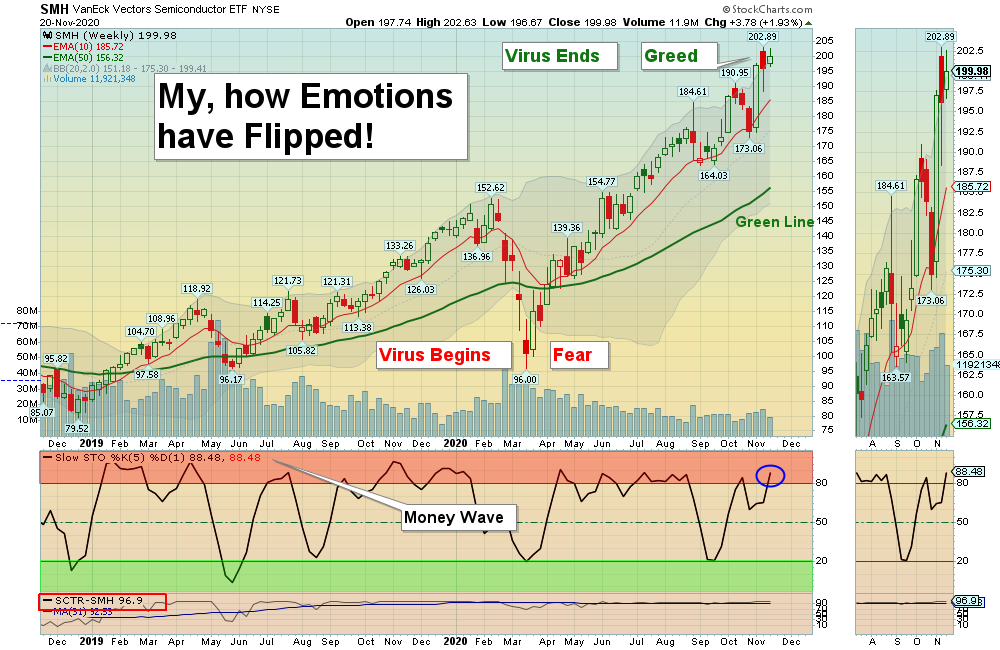
The Markets are now over-bought and probably need a Stimulus Plan to go higher. The CNN Fear & Greed Index went back up to 70, from a recent low of 23 earlier this month.

SEE SUPPLEMENTAL CHARTS

For the week the Dow was down 0.89%, the S&P 500 was down  0.77%, and the Nasdaq 100 was down 0.19%. The Long Term Trend for the Indices is up. 

The Inflation Index (CRB) was up 2.84% and is Above the Green Line, indicating Economic Strength.

Bonds  were up 2.12% for the week and are Above the Green Line, indicating Economic Weakness.

The US DOLLAR was down 0.40% for the week and is Below the Green Line. 

Crude Oil was up 5.71% for the week at $42.42 and GOLD was down 0.73%  at $1872.40.

_____________________________________________________________________________________________

MONEY WAVE BUYS SOON

We are currently in 6 logged Current Positions, for the Short & Medium Term.  There are 2 Investments on the Short Term Watch List. 

Be patient and WAIT for Green Zone Buy Signals!

______________________________________________________________________________________________

LONG TERM INVESTMENTS  (Most of the Leaders are back up in the Weekly Red Zones.)

Buy the Leading Investments that are down near the Weekly Green Zones.      

ALT      ALTIMMUNE  INC.          Buy if it Closes above the Red Line of $12.25 on High Volume.     

CRON      CRONOS GROUP      Buy if it Closes above $9.00 on High Volume.     

FCEL      FUELCELL ENERGY INC.      Shot up 92 % this week!       

INSG      INSEEGO CORP.      Buy when it Closes above the Red Line around $9.85.     

NVAX      NOVAVAX INC.      Buy when it Closes above $98.24.     

RIOT      RIOT BLOCKCHAIN      Shot up 50 % this week! 

VBIV      VBI VACCINES INC.          Bought above the Red Line of $2.81 this week.  Target is $4.25.  EXIT if it is going to Close below the Green Line of $2.48.

______________________________________________________________________________________

Click for  Current Positions
Click for  Watch List
Click for  Closed Positions

Penny Stock Watch List

TOP 100 LIST Nov 4, 2020

Dividend Growth Portfolio  

ETF Sector Rotation System 

Dogs of the DOW System

Long Term Strategy for IRAs & 401k Plans

CNN Fear & Greed Index

Alert! Market Risk is HIGH (Red Zone). The probability of successful Short Term Trades is better, when the % of stocks above the 50-day avg. is below 20. 

Tell your Friends about the Green Line, and Help Animals.

___________________________________________________________________________________________

QUESTION:   Jeff writes “Hello, in trying to understand your DONT TAKE A LOSS comments, why don’t you raise the stop loss when the stock is up so much? I am not capturing a lot of upside as I get out conservatively (I stopped myself out at 20% on this trade). Is the point to let them run with a large stop loss to capture maximum upside?     

ANSWER:  Hi Jeff. When the Money Wave > 50, then the Stop is raised to the Buy Price. (Don’t Take a Loss!). There was also a Target on MGNI of $12, so you could Raise the Stop to $12.

In this Market, we do just what you do:  Blow out with a nice gain…  Holding on for more could be determined by calculatin a Reward / Risk ratio of 2:1 (which would also say SELL). Some members may be longer term, or like to follow the Rules.

Thanks for writing.

ATGL

Related Post

– Green Line Weekly Nov 15, 2020

Subscribe to Our Newsletter

AGL Logo

Get our eBook Now!

Candlestick - A Swing Traders Friend

We don’t spam! Read our privacy policy for more info.

You’ve been successfully subscribed to our newsletter!

Voted #1 at Stock Charts

SH Chart
Inverse S&P 500 Fund (SH) will have a Money Wave Buy today.

Help Us Help Animals

Help Us Help Animals

Recent Comments

  • Market Breadth Indicators: A Trader’s Guide to Early Trend Detection on Backtesting: Definition and How a Trading Strategy Backtest Works
  • Island Reversal Pattern: Definition and Formation Explained on Double Top Pattern: How to Identify and Trade This Reversal Signal
  • Channel Pattern Guide: What It Is and Why It Matters on A Guide to Forecasting Using Moving Averages
  • What Is a Broadening Bottom Chart Pattern? Full Guide on Bull vs. Bear Market: An Investor’s Guide to Market Phases
  • ATGL Weekly Money Flow - 2025-05-11 on ATGL Top Pick of the Week! Apr 6, 2025

Become a Green Liner!

Help me make more Money in the Stock Market.

ON ATGL

  • DashBoard
  • Weekly Commentary
  • Daily Buy / Sell Signals
  • Day Trade Setup
  • Trading Rooms

Design & Develop By Pixelvect

STRATEGIES

  • Swing Trading
  • ATGL Pick of the Week
  • Dividend Growth
  • ETF Sector Rotation
  • Dogs of the Dow

HELP

  • ATGL Trading Rules
  • FAQ
  • Account Maintenance
  • Contact US
  • Join

FOLLOW US

Instagram Linkedin Twitter Facebook

© COPYRIGHT 2024 · ABOVETHEGREENLINE.COM · ALL RIGHTS RESERVED · PRIVACY · TERMS · CONTACT · WATCHLIST · CURRENT