
11/20/2022 Markets were mixed to lower for the week as Indices are still over-bought from the sharp bounce up from the October lows. The DOW 30 Index is now well Above the Green Line, but the other major Indices have stalled Below the Green Lines.
The US Dollar and long term Interest Rates have come down, as the Economy has weakened from FED Tightening. Crude Oil dropped 9.95% for the week at $80.11, and Treasury Bonds might have finally bottomed (maybe down once more to re-test the lows soon).
Now many are waiting on the next FED Meeting on Dec 14th, to see if the FED will continue tightening (raising short term Interest Rates). The Stock Markets need the FED to recognize how the Economy and Inflation have slowed down, and for the FED to start talking about ending their FED Tightening. Then Stock Markets can move higher (if the FED does not wait too long and kills the Economy).
Short term we will raise some Cash as the Dollar and long term Interest Rates should have enough upward momentum to go back up and re-test the recent highs again (UUP & TBT Buys soon). The Media will probably create another mild FEAR problem, causing a dump of Stocks so we can load up again.
If you continue to Follow the Green Line System, your Money should flow into the Strongest areas and your account value should be able to grow in both Bull and Bear Markets.
________________________________________________________________________________________________________________________________________________
For the week the Dow was up 0.08%, the S&P 500 was down 0.62%, and the NASDAQ 100 down 1.09%. Currently the major Stock Indices (except the DOW 30) are Below the Green Lines and have low Relative Strength (own stronger Securities here).
The Inflation Index (CRB) was down 3.29% for the week and is Above the Green Line, indicating Economic Expansion.
Bonds were up 1.79 % for the week, and are Below the Green Line, indicating Economic Expansion.
The US DOLLAR was up 0.62% for the week and is Above the Green Line.
Crude Oil was down 9.95% for the week at $80.11 and GOLD was down 0.85% at $1754.40.
More action this week on the Day Trading Scrolling Charts.
DAY TRADING CHARTS FOR INDICES & LARGE CAPS.
We have not had many intra-day Trade Alert signals lately as the Volume has been too Low with the Buy Signals. These low Volume Buy Signals tend to pop up and quickly fade back down. We like to see High Volume on rallies.
_____________________________________________________________________________________________
MONEY WAVE BUYS SOON:
We are in now in 6 logged Current Positions for the Short & Medium Term. There are 5 investments on the Short Term Watch List.
Be patient and WAIT for Green Zone Buy Signals!
LONG TERM INVESTMENTS: (Hard to find many Long Term now because most normal Investments no longer have 80 Relative Strength required.)
Long Term Scrolling Charts (Real Time)
AVXL ANAVEX LIFE SCIENCES Wait for the next Daily Money Wave Buy Signal.
BLU BELLUS HEALTH Buy if it Closes above $9.84 with High Volume.
CROX CROX INC. Wait for the next Daily Money Wave Buy Signal.
PBR PETROBAS ENERGY Wait for the next Weekly Money Wave Buy Signal.
PDD PINDUODUO INC. Buy if it Closes above $73.02 with High Volume. (now in Stage 1 Base).
SIGA SIGA TECH. Wait for Close back Above the Green Line.
VIPS VIPSHOP HOLDINGS Buy if it Closes above $13.32 with High Volume. (now in Stage 1 Base).
______________________________________________________________________________________________________
My Trading Dashboard
Swing Trading Scrolling Charts
Day Trading Scrolling Charts
Click for Watch Lists
Click for Current Positions
Click for Closed Positions
Updated Top 100 List Nov 1, 2022
Dividend Growth Portfolio
Updated ETF Sector Rotation System
Dogs of the DOW System
Long Term Strategy for IRAs & 401k Plans
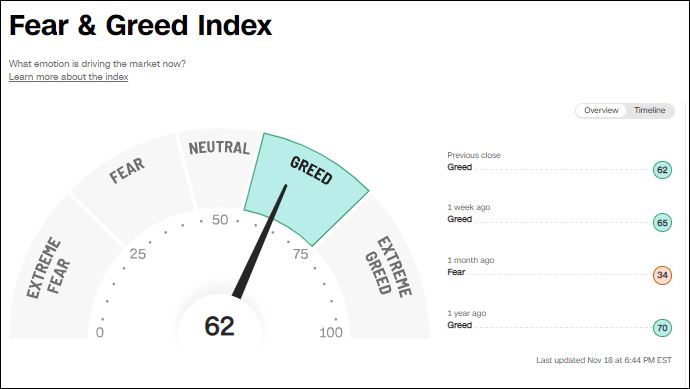
CNN Fear & Greed Index
Scrolling Stage Chart Investing Charts
Alert! Market Risk is High (RED). The probability of successful Short Term Trades is better, when the % of stocks above the 50-day avg. is below 20.
Tell your Friends about the Green Line, and Help Animals.
________________________________________________________________________________
QUESTION: Winter writes ““Don’t take a Loss” confuses me. What does that mean?”
ANSWER: When the Investment has a Money Wave Buy Signal, it should pop up 3-6 % in just a few days.
If it is not popping up well, and the Money Wave > 50, plan to Get out soon , and Don’t Take a Loss! (Get Out Even).
Something must be Wrong. There will be plenty more Money Wave Signals soon… Raise Cash, and don’t get Stuck! Wait for the next one.
Good trading and tell your friends!
ATGL
