
11/14/2021 Markets were slightly lower this week, as the major Indices were stretched Way Above the Green Lines. The Selling is mild, but when Investments do pull back, the Buying Volume has not picked up much on Buy Signals. This indicates a tired Market, but there were enough New Highs on Earnings recently to probably hold the Markets up a while longer. With plenty more of FED Printing, most do not want to Sell. The Markets are currently over-bought based on the Green Line, and the Buying Volume has been low.
The FED is going to Taper $15 Billion of monthly DEBT Buying later this month, so we will see if that effects Long Term Bond prices. Lately Bonds have been shooting up on Slow Down Fears from the Supply Chain problem. There are plenty of Bearish Divergences (warning signs) in the Markets, and historically these Bearish Divergences would have lead to larger corrections. But currently most are not going to “Fight the FED”.
If you continue to Follow the Green Line System, your Money should flow into the Strongest areas and your account value should be able to grow in both Bull and Bear Markets.
There has been plenty of action daily on the Day Trading Scrolling Charts.
For the week the Dow was down 0.63%, the S&P 500 was down 0.27%, and the NASDAQ 100 was down 0.97%. The Long Term Trend for the Indices is up.
The Inflation Index (CRB) was up 0.89% for the week and is Above the Green Line, indicating Economic Expansion.
Bonds were down 1.32% for the week, and are back Above the Green Line, indicating Economic Contraction.
The US DOLLAR was up 0.86% for the week and is Above the Green Line.
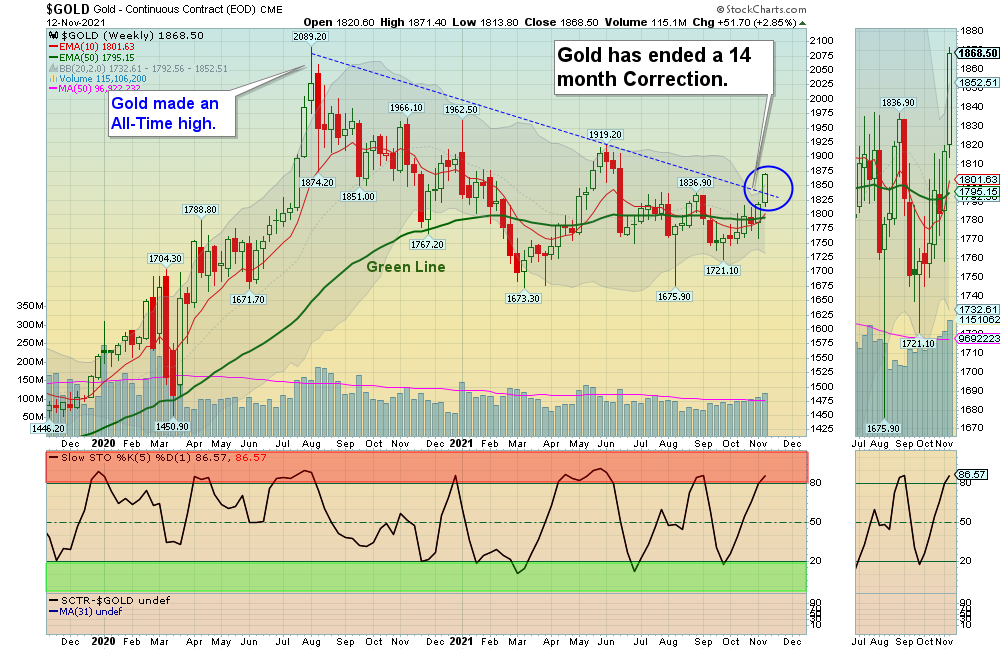
Crude Oil was down 0.59% for the week at $80.79 and GOLD was up 2.85% at $1868.50. Gold broke above the down trend line.
_____________________________________________________________________________________________
MONEY WAVE BUYS SOON
We are currently in only 2 logged Current Positions, for the Short & Medium Term (Most Leaders are coming down from the Red Zones). There are 8 investments on the Short Term Watch List.
Be patient and WAIT for Green Zone Buy Signals!
______________________________________________________________________________________________
LONG TERM INVESTMENTS (most Leaders are near Highs, and most Large Caps no longer have 80 Relative Strength required.)
Long Term Scrolling Charts (Real Time)
BNTX BIO N TECH Wait for the next Daily Money Wave Buy Signal.
BTU PEABODY ENERY CORP. Wait for the next Daily Money Wave Buy Signal.
COF CAPITAL ONE FINANCIAL Wait for the next Daily Money Wave Buy Signal.
DKS DICKS SPORTING GOODS Target was already Hit at $135. Avoid.
MRNA MODERNA INC. Wait for the next Daily Money Wave Buy Signal. Must also Close back above the Green Line.
______________________________________________________________________________________
My Trading Dashboard
Swing Trading Scrolling Charts
Day Trading Scrolling Charts
Click for Watch Lists
Click for Current Positions
Click for Closed Positions
Updated Top 100 List Nov 2, 2021
Dividend Growth Portfolio
ETF Sector Rotation System
Dogs of the DOW System
Long Term Strategy for IRAs & 401k Plans
CNN Fear & Greed Index
Scrolling Stage Chart Investing Charts
Alert! Market Risk is HIGH (Red Zone). The probability of successful Short Term Trades is better, when the % of stocks above the 50-day avg. is below 20.
Tell your Friends about the Green Line, and Help Animals.
______________________________________________________________________________________
QUESTION: Kinch writes “I am only receiving a notification about the market about 10 minutes before the market closes. I never get a text message about any trades. Is this the way it works?”
ANSWER: Hi Kinch. Most subscribers do best with the End of Day Swing Trading (email arrives just before the Market Close).
We do send out Day Trade Alerts by Twitter, if you want to set up a free Twitter account. These Alerts are also on the Main Menu: Stock Alerts
For Twitter, please install the app on your cell, and set up mobile notifications:
Please Follow Us @AboveGreenLine on Twitter and click on the bell icon to set up mobile notifications.
Thanks for writing,
ATGL
