Above the Green Line -01
  • Market Insights
        • Commentary
          • Daily
          • Weekly
        • BUY / SELL SIGNALS
          • Trade Posts
          • Recent Trade Alerts
          • Recent Day Trades
        • BLOGROLL
          • Dividend Growth Blog
          • ETF Sector Blog
          • Dow Dogs
          • TPOW Blog
  • Strategies
        • SWING TRADING
          • Current Positions
          • Watchlists
          • Closed Positions
          • Candidates - TOP 100
          • Specialty Stocks
        • WEEKLY STOCK PICK
          • TPOW Charts
          • TPOW Performance
          • TPOW Strategy Guide
          • TPOW Performance Dashboard
        • DAY TRADING
          • Watch List
        • ATGL DASHBOARD
        • ETF STRATEGIES
          • ETF Sector Rotation
          • ETF Sector Portfolio
        • DIVIDEND GROWTH
          • Dividend Growth Portfolio
          • Dividend Calendar
        • DOGS OF THE DOW
          • Dogs of the Dow Portfolio
          • DOW 5 Portfolio
  • Markets
        • US MARKET
          • Commodities
          • Energy
          • Precious Metals
          • Volatility
        • GLOBAL MARKETS
          • Market Indices
          • Economic Calendar
          • FOREX Heat Map
          • FOREX Cross Rates
          • Crypto Currency Market
  • Investing
    • Discord Community
    • Dashboard
  • Resources
        • ARTICLES
          • Dividend Growth Model Articles
          • ETF Articles
          • Investment Strategies Articles
          • Market and Economic Insights
          • Stock Trade Articles
          • Stock Reviews
        • TOOLS
          • Stock Scanners
          • Charting Software
          • Brokerage Firms
        • STOCK CHARTS
          • Key Components
          • Reading Charts
          • Drawing Stock Charts
          • Identifying Trends
        • RETIREMENT PLANNING
  • About
    • Contact Us
    • How to Win
    • #1 At Stockcharts
    • Disclaimer
    • FAQ
  • Log In
  • Subscribe

May 30, 2021

Green Line Weekly May 30, 2021

SPY Chart
The Longest Bull Market in History from FED Printing.

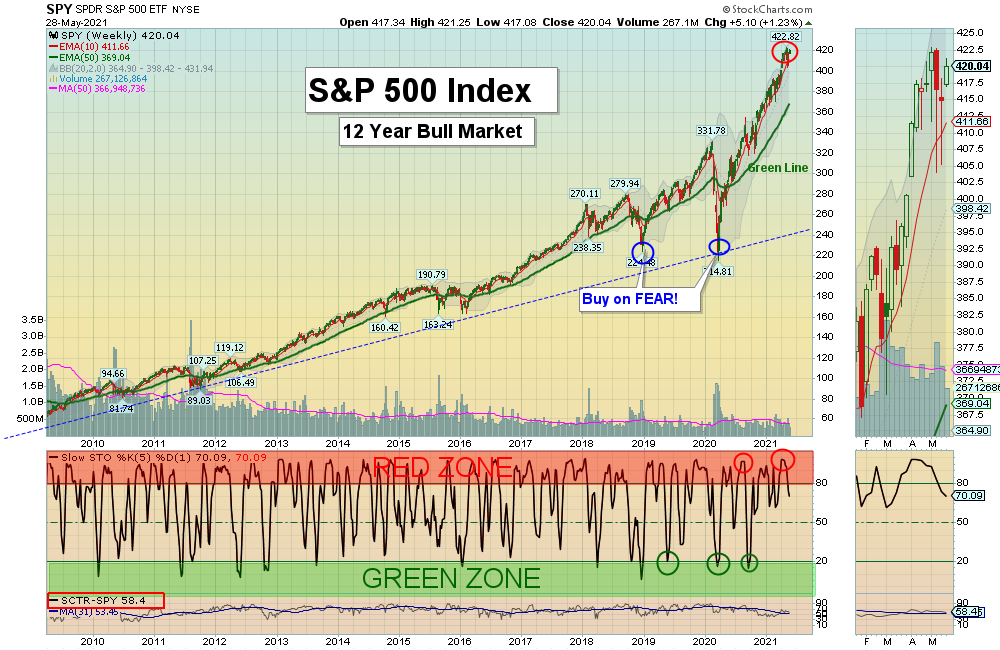
5/30/2021 Markets were up slightly for the week as the Stock Indices are trying to get back up to the recent Highs. Markets are over-bought (Way Above the Green Lines) because of low Interest Rates and FED Printing. Inflation is back, and if the FED does not quit Printing, Inflation will probably get worse. So which month will the FED cut back?  Are you prepared for that?

It has been harder to make money this quarter as the Volume is lower from lack of good Buying at these levels. There are several Long Term Investments below that have already corrected 30 % (down near the Green Lines) and should pop back up again. The Green Line mainly follows these Momentum Stocks, so trading should improve when these normally bounce back up.  

SEE SUPPLEMENTAL CHARTS

For the week the Dow was up 1.05%, the S&P 500 was up 1.23%, and the Nasdaq 100 was up 2.12%. The Long Term Trend for the Indices is up.  

The Inflation Index (CRB) was up 2.40% for the week and is Above the Green Line, indicating Economic Expansion.

Bonds were up 0.56% for the week, and are Below the Green Line, indicating Economic Expansion.

The US DOLLAR was down 0.01% for the week. 

Crude Oil was up 4.31% for the week at $66.32 and GOLD was up 1.52%  at $1905.30.

_____________________________________________________________________________________________

MONEY WAVE BUYS SOON

We are currently in 6 logged Current Positions, for the Short & Medium Term.  There are only 2 Investments on the Short Term Watch List. 

Be patient and WAIT for Green Zone Buy Signals!

______________________________________________________________________________________________

LONG TERM INVESTMENTS  (Several Leaders have pulled back, but Markets are on Highs.)

SCROLLING Charts (Real Time)

DBC      COMMODITY FUND      Buy on the next Daily Money Wave Buy Signal with High Volume.     
ETSY      ETSY INC.      Buy if it Closes above $175.14 with High Volume.
FCEL      FUELCELL ENERGY INC.       Buy if it Closes above the Red Line (50-day avg.) with High Volume.     
ICLN      GLOBAL CLEAN ENERGY FUND    Buy if it Closes above the Red Line (50-day avg.) with High Volume.
LAC      LITHIUM AMERICAS FUND       Closed above the Red Line (50-day avg.) but the Volume was not High.

PENN     PENN NATIONAL GAMING      Buy if it Closes above the Red Line (50-day avg.) with High Volume.
PLUG      PLUG POWER INC.      Buy if it Closes $31.82 with High Volume.     

RIOT      RIOT BLOCKCHAIN      Buy on the next Daily Money Wave Buy Signal with High Volume.       
TAN      SOLAR FUND        Buy if it Closes above the Red Line (50-day avg.) with High Volume. 
TRIP      TRIPADVISOR INC.    Buy if it Closes above the Red Line (50-day avg.) with High Volume.       
TSLA      TESLA INC.      Buy if it Closes above the Red Line (50-day avg.) with High Volume.
XBI      BIOTECH FUND        Buy if it Closes above the Red Line (50-day avg.) with High Volume. (Relative Strength is below 80).     

ZKIN       ZK INT’L. GROUP      Buy if it Closes above the Red Line (50-day avg.) with High Volume.

______________________________________________________________________________________

Click for  Watch Lists
Click for  Current Positions
Click for  Closed Positions

New: My Trading Dashboard

Day Trading Watch List
NEW Top 100 List May 1, 2021
Dividend Growth Portfolio  
ETF Sector Rotation System      
Dogs of the DOW System
Long Term Strategy for IRAs & 401k Plans
CNN Fear & Greed Index
Scrolling Stage Chart Investing Charts

Alert! Market Risk is HIGH (Red Zone). The probability of successful Short Term Trades is better, when the % of stocks above the 50-day avg. is below 20. 

Tell your Friends about the Green Line, and Help Animals.

___________________________________________________________________________________________

4 Ways to Get your Daily Money Wave Alert:

  • Emailed to your box between 3:40 3:50 pm EST.
  • Website menu Commentary/Buy/Sell Signals
  • Twitter notifications are the fastest @AboveGreenLine
  • Text messages: Email us your Cell number & phone carrier.

Thank you,

ATGL

Related Post

– Green Line Weekly May 23, 2021

Subscribe to Our Newsletter

AGL Logo

Get our eBook Now!

Candlestick - A Swing Traders Friend

We don’t spam! Read our privacy policy for more info.

You’ve been successfully subscribed to our newsletter!

Voted #1 at Stock Charts

SH Chart
Inverse S&P 500 Fund (SH) will have a Money Wave Buy today.

Help Us Help Animals

Help Us Help Animals

Recent Comments

  • Want to Protect Your Capital? Start With Better Position Sizing on Risk Management in Trading: Tools and Techniques
  • Want to Protect Your Capital? Start With Better Position Sizing on Swing Trading Risk Management: Tips To Safeguard Your Profits
  • Price Action Trading Strategies That Work in Any Market on What Is a Death Cross in Stocks? A Bearish Market Signal
  • ATGL Weekly Money Flow - 2025-07-13 on AGTL Top Pick of the Week! May 11, 2025
  • Market Breadth Indicators: A Trader’s Guide to Early Trend Detection on Backtesting: Definition and How a Trading Strategy Backtest Works

Become a Green Liner!

Help me make more Money in the Stock Market.

ON ATGL

  • DashBoard
  • Weekly Commentary
  • Daily Buy / Sell Signals
  • Day Trade Setup
  • Trading Rooms

Design & Develop By Pixelvect

STRATEGIES

  • Swing Trading
  • ATGL Pick of the Week
  • Dividend Growth
  • ETF Sector Rotation
  • Dogs of the Dow

HELP

  • ATGL Trading Rules
  • FAQ
  • Account Maintenance
  • Contact US
  • Join

FOLLOW US

Instagram Linkedin Twitter Facebook

© COPYRIGHT 2024 · ABOVETHEGREENLINE.COM · ALL RIGHTS RESERVED · PRIVACY · TERMS · CONTACT · WATCHLIST · CURRENT