Above the Green Line -01
  • Market Insights
        • Commentary
          • Daily
          • Weekly
        • BUY / SELL SIGNALS
          • Trade Posts
          • Recent Trade Alerts
          • Recent Day Trades
        • BLOGROLL
          • Dividend Growth Blog
          • ETF Sector Blog
          • Dow Dogs
          • TPOW Blog
  • Strategies
        • SWING TRADING
          • Current Positions
          • Watchlists
          • Closed Positions
          • Candidates - TOP 100
          • Specialty Stocks
        • WEEKLY STOCK PICK
          • TPOW Charts
          • TPOW Performance
          • TPOW Strategy Guide
          • TPOW Performance Dashboard
        • DAY TRADING
          • Watch List
        • ATGL DASHBOARD
        • ETF STRATEGIES
          • ETF Sector Rotation
          • ETF Sector Portfolio
        • DIVIDEND GROWTH
          • Dividend Growth Portfolio
          • Dividend Calendar
        • DOGS OF THE DOW
          • Dogs of the Dow Portfolio
          • DOW 5 Portfolio
  • Markets
        • US MARKET
          • Commodities
          • Energy
          • Precious Metals
          • Volatility
        • GLOBAL MARKETS
          • Market Indices
          • Economic Calendar
          • FOREX Heat Map
          • FOREX Cross Rates
          • Crypto Currency Market
  • Investing
    • Discord Community
    • Dashboard
  • Resources
        • ARTICLES
          • Dividend Growth Model Articles
          • ETF Articles
          • Investment Strategies Articles
          • Market and Economic Insights
          • Stock Trade Articles
          • Stock Reviews
        • TOOLS
          • Stock Scanners
          • Charting Software
          • Brokerage Firms
        • STOCK CHARTS
          • Key Components
          • Reading Charts
          • Drawing Stock Charts
          • Identifying Trends
        • RETIREMENT PLANNING
  • About
    • Contact Us
    • How to Win
    • #1 At Stockcharts
    • Disclaimer
    • FAQ
  • Log In
  • Subscribe

May 3, 2020

Green Line Weekly May 3, 2020

SPX Weekly
The S&P 500 Index has gone from the Green Zone to the Red Zone on the Weekly Chart.


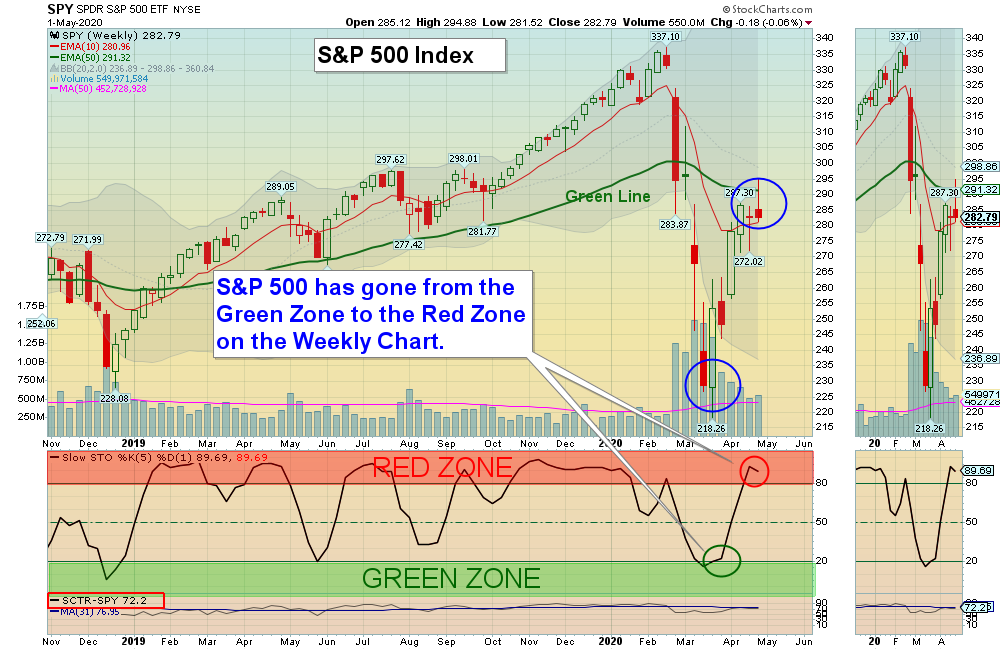
05/03/2020 Markets were down slightly this week after the S&P 500 Index went up and tagged the Green Lines and then backed off. The S&P 500 has retraced back up 62% of the decline from January (Fibonacci Retracement info).  A Fibonacci retracement strategy can point to possible corrections or reversals based on human behavior.

However, the Leaders are now back down in the Green Zones and should bounce soon. Leaders that just made New Highs should go back up to re-test the Highs. Please study the  Watch List   for Money Wave Buy Signals soon. 

It looks like the weaker Indices (DOW 30 Index, Small Caps, Transports, & NYSE) could be doing an A-B-C Correcting rally back up from very over sold levels. Investments that are still Below the Green Line could drop again.  

The Green Line System has been closing out most positions that were bought before Covid 19, and the Strongest Indices Semiconductor (SMH), NASDAQ 100 (QQQ), and the Tech Fund (XLK) were able to recover all of the losses. This shows the advantage of owning the Strongest Investments, as they recover first. Many weaker Investments are still way down and Below the Green Lines.

For the week the Dow was down 0.23%, the S&P 500 was down 0.06%, and the Nasdaq 100 was down 0.51%. The Long Term Trend for the Indices is mixed. 

The Inflation Index (CRB) was up 4.32 % and is Below the Green Line, indicating Economic Weakness.

Bonds  were down 1.56 % for the week and are Above the Green Line, indicating Economic Weakness.

The US DOLLAR was down 1.56 % for the week. 

Crude Oil was up 16.77 % for the week at $19.78 and GOLD was down 2.00 %  at $1700.90.

_____________________________________________________________________________________________

MONEY WAVE BUYS SOON:   

We are currently in 4 logged Open Positions, for the Short & Medium Term.  There are 10 Investments on the Short Term Watch List. 

Be patient and WAIT for Green Zone Buy Signals!

______________________________________________________________________________________________

LONG TERM INVESTMENTS  (Most of the Leaders are back up in the Weekly Red Zones.)

Buy the Leading Investments that are down near the Weekly Green Zones.     

GDX     GOLD MINING FUND      Closed $31.84 but the Volume was not High. Wait for next Daily Green Zone Buy.  All time High is $62.

KALA     KALA PHARM.          Wait for next Daily Green Zone Buy Signal.  (Volume was not High last week on break out.)

______________________________________________________________________________________

Click for  Portfolio (Open Positions)
Click for  Watch List
Click for  Closed Positions


NEW TOP 100 LIST MAY 1, 2020

Dividend Growth Portfolio  (we are now posting a Dividend Calendar for the entire portfolio to assist with planning purposes).

ETF Sector Rotation System –  New Quarterly Rotation was on Apr 1, 2020.

Dogs of the DOW System

Long Term Strategy for IRAs & 401k Plans:   

Alert! Market Risk is MEDIUM (Yellow Zone). The probability of successful Short Term Trades is better, when the % of stocks above the 50-day avg. is below 20. 

Tell your Friends about the Green Line, and Help Animals

___________________________________________________________________________________________

4 Ways to Get your Daily Money Wave Alert:

  • Emailed to your box between 3:30 3:50pm EST.
  • Website menu Commentary/Buy/Sell Signals
  • Twitter notifications @AboveGreenLine
  • Text messages: Email us your Cell number & phone carrier.

Related Post

– Green Line Weekly Apr 26, 2020

Subscribe to Our Newsletter

AGL Logo

Get our eBook Now!

Candlestick - A Swing Traders Friend

We don’t spam! Read our privacy policy for more info.

You’ve been successfully subscribed to our newsletter!

Voted #1 at Stock Charts

SH Chart
Inverse S&P 500 Fund (SH) will have a Money Wave Buy today.

Help Us Help Animals

Help Us Help Animals

Recent Comments

  • Market Breadth Indicators: A Trader’s Guide to Early Trend Detection on Backtesting: Definition and How a Trading Strategy Backtest Works
  • Island Reversal Pattern: Definition and Formation Explained on Double Top Pattern: How to Identify and Trade This Reversal Signal
  • Channel Pattern Guide: What It Is and Why It Matters on A Guide to Forecasting Using Moving Averages
  • What Is a Broadening Bottom Chart Pattern? Full Guide on Bull vs. Bear Market: An Investor’s Guide to Market Phases
  • ATGL Weekly Money Flow - 2025-05-11 on ATGL Top Pick of the Week! Apr 6, 2025

Become a Green Liner!

Help me make more Money in the Stock Market.

ON ATGL

  • DashBoard
  • Weekly Commentary
  • Daily Buy / Sell Signals
  • Day Trade Setup
  • Trading Rooms

Design & Develop By Pixelvect

STRATEGIES

  • Swing Trading
  • ATGL Pick of the Week
  • Dividend Growth
  • ETF Sector Rotation
  • Dogs of the Dow

HELP

  • ATGL Trading Rules
  • FAQ
  • Account Maintenance
  • Contact US
  • Join

FOLLOW US

Instagram Linkedin Twitter Facebook

© COPYRIGHT 2024 · ABOVETHEGREENLINE.COM · ALL RIGHTS RESERVED · PRIVACY · TERMS · CONTACT · WATCHLIST · CURRENT