Above the Green Line -01
  • Market Insights
        • Commentary
          • Daily
          • Weekly
        • BUY / SELL SIGNALS
          • Trade Posts
          • Recent Trade Alerts
          • Recent Day Trades
        • BLOGROLL
          • Dividend Growth Blog
          • ETF Sector Blog
          • Dow Dogs
          • TPOW Blog
  • Strategies
        • SWING TRADING
          • Current Positions
          • Watchlists
          • Closed Positions
          • Candidates - TOP 100
          • Specialty Stocks
        • WEEKLY STOCK PICK
          • TPOW Charts
          • TPOW Performance
          • TPOW Strategy Guide
          • TPOW Performance Dashboard
        • DAY TRADING
          • Watch List
        • ATGL DASHBOARD
        • ETF STRATEGIES
          • ETF Sector Rotation
          • ETF Sector Portfolio
        • DIVIDEND GROWTH
          • Dividend Growth Portfolio
          • Dividend Calendar
        • DOGS OF THE DOW
          • Dogs of the Dow Portfolio
          • DOW 5 Portfolio
  • Markets
        • US MARKET
          • Commodities
          • Energy
          • Precious Metals
          • Volatility
        • GLOBAL MARKETS
          • Market Indices
          • Economic Calendar
          • FOREX Heat Map
          • FOREX Cross Rates
          • Crypto Currency Market
  • Investing
    • Discord Community
    • Dashboard
  • Resources
        • ARTICLES
          • Dividend Growth Model Articles
          • ETF Articles
          • Investment Strategies Articles
          • Market and Economic Insights
          • Stock Trade Articles
          • Stock Reviews
        • TOOLS
          • Stock Scanners
          • Charting Software
          • Brokerage Firms
        • STOCK CHARTS
          • Key Components
          • Reading Charts
          • Drawing Stock Charts
          • Identifying Trends
        • RETIREMENT PLANNING
  • About
    • Contact Us
    • How to Win
    • #1 At Stockcharts
    • Disclaimer
    • FAQ
  • Log In
  • Subscribe

May 2, 2021

Green Line Weekly May 2, 2021

SPY Chart
This is the Longest Bull Market in our history.

5/2/2021 Markets were mixed again for the week as the S&P 500 and DOW 30 Indices struggled to make Higher Highs. Great Earnings from FAAMNG Stocks Amazon, Apple, FaceBook, and Google could not help the Markets rally higher. Usually a Market that does not bounce up from Good News is tired. A pull back to the Red Line (50-day average) should set up for better trading soon.

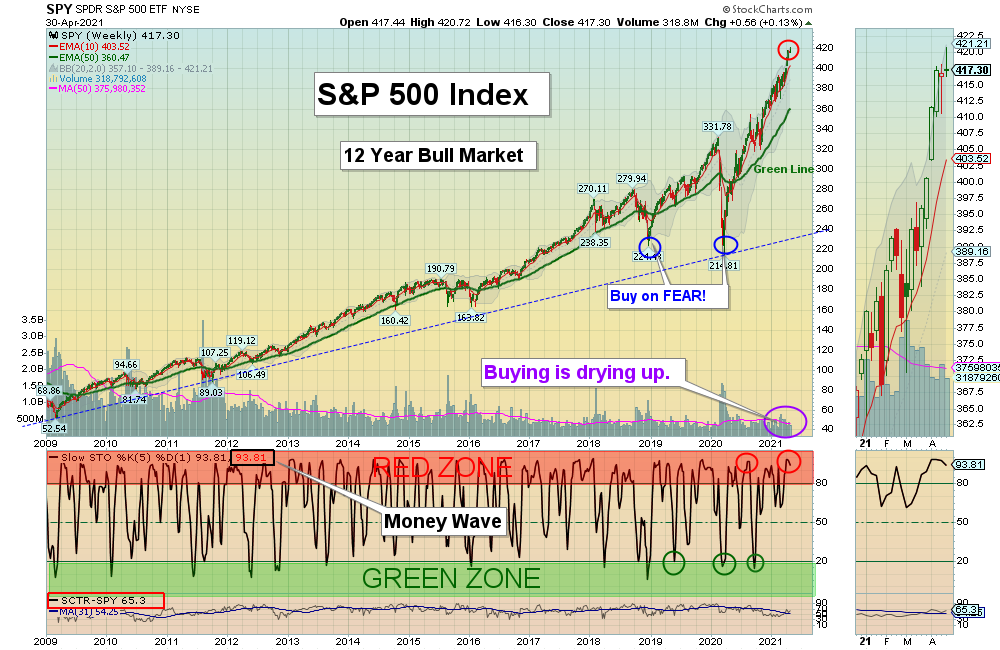
We know that the Markets are very extended (+85 % in the last year) and it is hard to make much Money lately. Conservative Investors should sit back and WAIT for the Indices to return near the Green Lines (like they always do).

There are several Long Term Investments below that have already corrected 30 % (down near the Green Lines) and should pop back up again. 

SEE SUPPLEMENTAL CHARTS

For the week the Dow was down 0.44%, the S&P 500 was up 0.13%, and the Nasdaq 100 was down 0.42%. The Long Term Trend for the Indices is up.  

The Inflation Index (CRB) was up 1.89% for the week and is Above the Green Line, indicating Economic Expansion.

Bonds were down 1.01% for the week, and are Below the Green Line, indicating Economic Expansion.

The US DOLLAR was up 0.47% for the week. 

Crude Oil was up 2.32% for the week at $63.58 and GOLD was down 0.57%  at $1767.70.

_____________________________________________________________________________________________

MONEY WAVE BUYS SOON

We are currently in 6 logged Current Positions, for the Short & Medium Term.  There are 4 Investments on the Short Term Watch List. 

Be patient and WAIT for Green Zone Buy Signals!

______________________________________________________________________________________________

LONG TERM INVESTMENTS  (Several Leaders have pulled back, but Markets are on Highs.)

SCROLLING Charts (Real Time)

FDX      FEDEX CORP.    Apr 29 Target Hit at $295 for a 13.8 % Gain.

BE      BLOOM ENERGY CORP.       Buy if it Closes above the Red Line (50-day avg.) with High Volume.  
FCEL      FUELCELL ENERGY INC.       Buy if it Closes above the Red Line (50-day avg.) with High Volume.     
ICLN      GLOBAL CLEAN ENERGY FUND      Buy if it Closes $24.94 with High Volume.
LAC      LITHIUM AMERICAS FUND      Buy if it Closes above the Red Line (50-day avg.) with High Volume.     

PENN     PENN NATIONAL GAMING      Buy if it Closes above the Red Line (50-day avg.) with High Volume.
PLUG      PLUG POWER INC.      Buy if it Closes $37.75 with High Volume.
XBI      BIOTECH FUND        Buy if it Closes above the Red Line (50-day avg.) with High Volume.
XOP      OIL & GAS EXPLORATION FUND      Volume was not High this week.     

______________________________________________________________________________________

Click for  Watch Lists
Click for  Current Positions
Click for  Closed Positions

New: My Trading Dashboard

Day Trading Watch List
NEW Top 100 List May 1, 2021
Dividend Growth Portfolio  
ETF Sector Rotation System      
Dogs of the DOW System
Long Term Strategy for IRAs & 401k Plans
CNN Fear & Greed Index
Scrolling Stage Chart Investing Charts

Alert! Market Risk is HIGH (Red Zone). The probability of successful Short Term Trades is better, when the % of stocks above the 50-day avg. is below 20. 

Tell your Friends about the Green Line, and Help Animals.

___________________________________________________________________________________________

4 Ways to Get your Daily Money Wave Alert:

  • Emailed to your box between 3:45 3:50pm EDT.
  • Website menu Commentary/Buy/Sell Signals
  • Twitter notifications are the fastest and most reliable @AboveGreenLine
  • Text messages: Email us your Cell number & phone carrier.

Thank you,

ATGL

Related Post

– Green Line Weekly Apr 25, 2021

Subscribe to Our Newsletter

AGL Logo

Get our eBook Now!

Candlestick - A Swing Traders Friend

We don’t spam! Read our privacy policy for more info.

You’ve been successfully subscribed to our newsletter!

Voted #1 at Stock Charts

SH Chart
Inverse S&P 500 Fund (SH) will have a Money Wave Buy today.

Help Us Help Animals

Help Us Help Animals

Recent Comments

  • Market Breadth Indicators: A Trader’s Guide to Early Trend Detection on Backtesting: Definition and How a Trading Strategy Backtest Works
  • Island Reversal Pattern: Definition and Formation Explained on Double Top Pattern: How to Identify and Trade This Reversal Signal
  • Channel Pattern Guide: What It Is and Why It Matters on A Guide to Forecasting Using Moving Averages
  • What Is a Broadening Bottom Chart Pattern? Full Guide on Bull vs. Bear Market: An Investor’s Guide to Market Phases
  • ATGL Weekly Money Flow - 2025-05-11 on ATGL Top Pick of the Week! Apr 6, 2025

Become a Green Liner!

Help me make more Money in the Stock Market.

ON ATGL

  • DashBoard
  • Weekly Commentary
  • Daily Buy / Sell Signals
  • Day Trade Setup
  • Trading Rooms

Design & Develop By Pixelvect

STRATEGIES

  • Swing Trading
  • ATGL Pick of the Week
  • Dividend Growth
  • ETF Sector Rotation
  • Dogs of the Dow

HELP

  • ATGL Trading Rules
  • FAQ
  • Account Maintenance
  • Contact US
  • Join

FOLLOW US

Instagram Linkedin Twitter Facebook

© COPYRIGHT 2024 · ABOVETHEGREENLINE.COM · ALL RIGHTS RESERVED · PRIVACY · TERMS · CONTACT · WATCHLIST · CURRENT