
3/13/2022 Markets were lower for the week, as the S&P 500 Index slipped back Below the Green Line on FEAR. The Indices still have not successfully re-tested the February Lows. If the S&P 500 Index cannot make a New Low soon, then we could finally see a bounce back up Above the Green Line. Normally Investments that made Highs in January will go back up to re-test the Highs (if there is nowhere else to put the money). In January, the Markets were Way Above the Green Lines but Tammy’s Greed would not allow her to take profits. Now Tammy’s Fear will not let her Buy Investments that are on Sale (and she is out of Cash from Buying High).
Here are most the Strongest Funds to have your Money in when they return back down to the Green Zones. If you are not making changes in your portfolio like Smart Money is doing, and rotating Funds into some of these you might become very frustrated. Inflation is already up (like we talked about a year ago), and when Interest Rates finally begin a Bull Market then historically traditional Stocks & Bonds could decline in value. But there should always be investments for Smart Money to rotate into. Are YOU Smart Money?
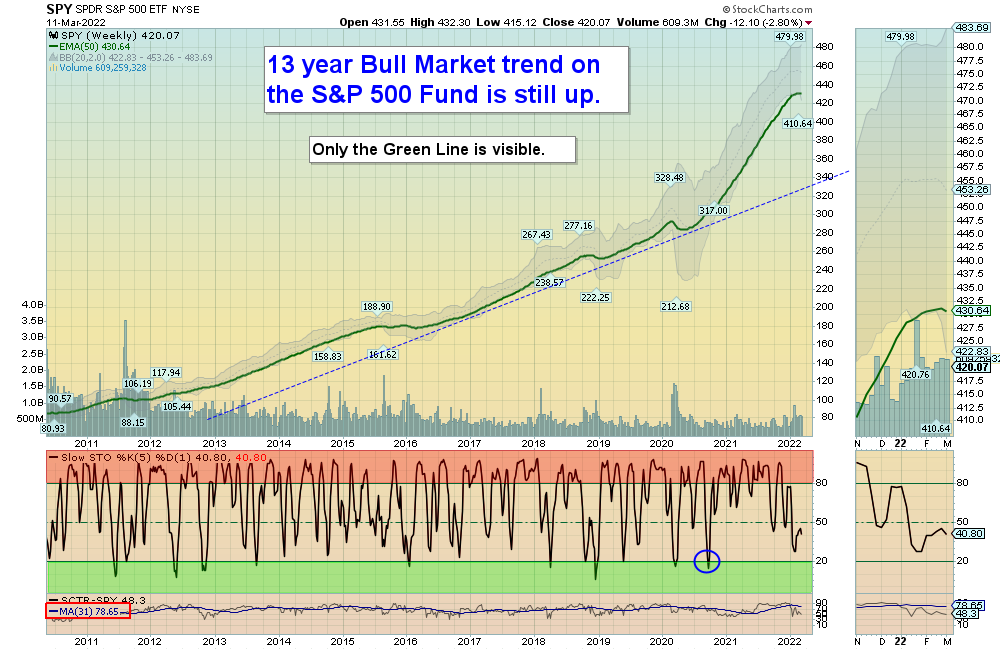
At the Green Line, we don’t predict, we follow the Money and history. And we only Buy Investments that are Above the Green Line (more Buyers than Sellers). Many investors are shocked now as 1/2 of their unmanaged Stocks are currently Below the Green Lines. And the Indices have not even started down much after 13 years up.
If you continue to Follow the Green Line System, your Money should flow into the Strongest areas and your account value should be able to grow in both Bull and Bear Markets.
There has been plenty of action on the Day Trading Scrolling Charts.
DAY TRADING CHARTS FOR INDICES & LARGE CAPS.
We have not had many intra-day Stock Alerts lately as the Volume has been too Low on Buy Signals. We like to see High Volume on rallies.
For the week the Dow was down 1.92%, the S&P 500 was down 2.80%, and the NASDAQ 100 was down 3.82%. The Long Term Trend for the Indices is up.
The Inflation Index (CRB) was down 1.62% for the week and is Above the Green Line, indicating Economic Expansion.
Bonds were down 3.80% for the week, and are Below the Green Line, indicating Economic Expansion.
The US DOLLAR was up 0.47% for the week and is Above the Green Line.
Crude Oil was down 5.49% for the week at $109.33 and GOLD was up 0.94% at $1985.
_____________________________________________________________________________________________
MONEY WAVE BUYS SOON
We are in 4 logged Current Positions for the Short & Medium Term, and we have plenty of CASH to Buy soon. There are 6 investments on the Short Term Watch List.
Be patient and WAIT for Green Zone Buy Signals!
_________________________________________________________________________________________
LONG TERM INVESTMENTS (many Large Caps no longer have 80 Relative Strength required.)
Long Term Scrolling Charts (Real Time)
AMD ADVANCED MICRO Buy if it Closes above the Red Line with High Volume.
F FORD MOTOR CO. Buy if it Closes above the Red Line with High Volume.
NVDA NVIDIA CORP. Buy if it Closes above the Red Line with High Volume.
XLK TECH FUND Buy if it Closes above the Red Line with High Volume.
XLRE REAL ESTATE FUND Buy if it Closes above $46.88 with High Volume.
________________________________________________________________________________
My Trading Dashboard
Swing Trading Scrolling Charts
Day Trading Scrolling Charts
Click for Watch Lists
Click for Current Positions
Click for Closed Positions
Updated Top 100 List Mar 1, 2022
Dividend Growth Portfolio
ETF Sector Rotation System
Dogs of the DOW System
Long Term Strategy for IRAs & 401k Plans
CNN Fear & Greed Index
Scrolling Stage Chart Investing Charts
Alert! Market Risk is LOW (Green). The probability of successful Short Term Trades is better, when the % of stocks above the 50-day avg. is below 20.
Tell your Friends about the Green Line, and Help Animals.
________________________________________________________________________________
QUESTION: Jim S. writes “Why do you use the 250 vs 200 or any other moving average? And, in a bear market, are you concerned that your Money Wave (slow sto line) might get stuck in the Green Zone for an extended period or give false breakout buy signals?
ANSWER: Hi Jim. The 250-day average (Green Line) has been back tested and has fewer “false Sell Signals” than the 200-day. The question should be: Why do most investors use the inferior 200-day average?
In the next Bear Market, we should be in Inverse Funds (like SH) which we were in the 2008 Bear (with good success)… In a Bear Market, most investments will be Below the Green Lines. The Green Line Rules do not allow us to own weaker investments Below the G L.
But historically there will always be investments Above the Green Lines, and we should have them for you.
Good trading and tell your friends!
ATGL


