Above The Green Line

  • Commentary
    • BUY / SELL SIGNALS
      • Trade Alerts
    • DIVGRO BLOG
    • ETF SECTOR BLOG
    • DOW DOGS BLOG
    • NEWS
    • STOCK IDEAS
  • Strategies
    • SWING TRADING
      • CURRENT POSITIONS
      • WATCHLISTS
      • CLOSED POSITIONS
      • CANDIDATES – TOP 100
      • SPECIALTY STOCKS
    • DAY TRADING
      • Watch List
    • DIVIDEND GROWTH
      • Dividend Growth Portfolio
      • Dividend Calendar
    • DOGS OF THE DOW
      • Dogs of the Dow Portfolio
      • DOW 5 Portfolio
    • ETF SECTOR ROTATION
      • ETF Sector Portfolio
  • Markets
    • US MARKET
      • Commodities
      • Energy
      • Precious Metals
      • Volatility
    • GLOBAL MARKETS
      • MARKET INDICES
      • ECONOMIC CALENDAR
      • FOREX HEAT MAP
      • FOREX CROSS RATES
      • CRYPTOCURRENCY MARKET
    • DASHBOARD
    • IDEAS
  • Investing
    • FORUM
  • Resources
    • ARTICLES
    • WEEKLY STOCK
    • RETIREMENT PLANNING
    • BLOGROLL
    • FAQ
  • About
    • CONTACT US
    • HOW TO WIN
    • #1 AT STOCKCHARTS
  • Log In
  • Subscribe

June 9, 2019

Green Line Weekly Jun 9, 2019

SPX Weekly Chart
The S&P 500 Index bounced up BIG off the Green Line!


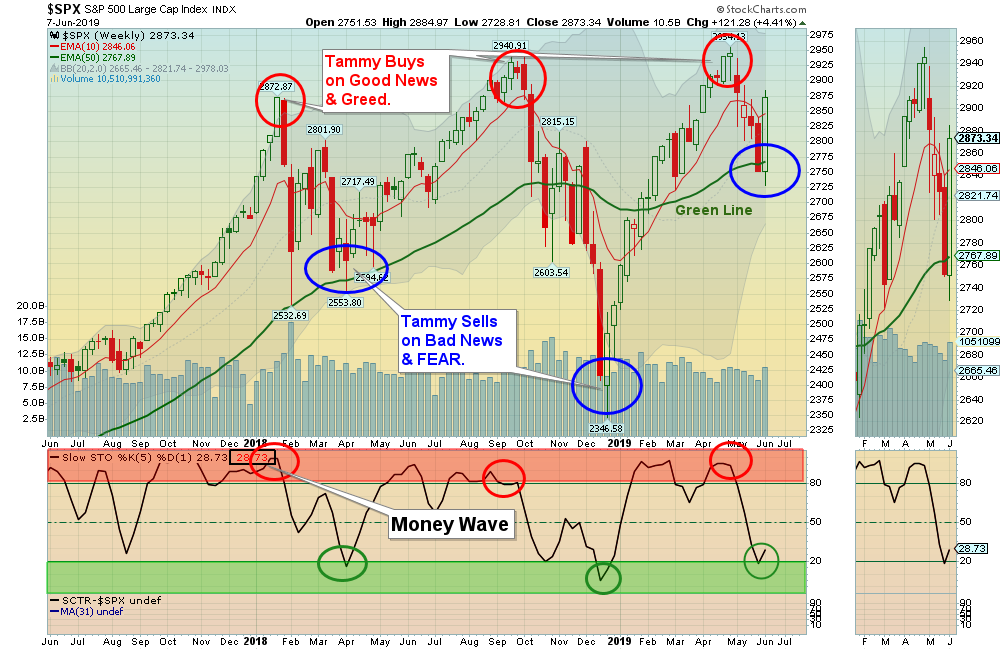
06/09/2019:  Markets were up big for the week, the Indices bounced up near the Green Lines. The down move from the April Highs was probably an A-B-C Correction, and after some backing and filling the Markets could go back up to re-test those Highs.

The FEAR and Bad News now has quickly disappeared… Remember, Smart Money Buys on Bad News and Sells on Good News.

Bonds  see an Economic Slow Down coming, but are Way Above the Green Line (which means that Emotions have caused Buyers to over-react). That means Bonds will probably drop (possibly more FED Printing or Trade Deal?)

For the week the Dow was up 4.85%, the S&P 500 was up 4.41%, and the Nasdaq 100 was up 4.08%.  The very Long Term Trend on the Stock Markets is UP.  

The Inflation Index (CRB) was down 0.54% and is Below the Green Line, indicating Economic Weakness.

Bonds were up 0.14% for the week and are Above the Green Line, indicating Economic Weakness.

The US DOLLAR was down 1.06% after being over-bought and almost near a 3 year High. 

Crude Oil was up 0.92% for the week at $53.99, and GOLD was up 2.67%  at $1311.

___________________________________________________________________________________________

COMPLETED TRADES THIS WEEK:

2019-05-29   PLNT      Planet Fitness    $74.56   2019-06-07          $77.96   $3.40     4.56%

2019-05-30   SBUX     StarBucks Corp. $76.17   2019-06-07          $82.48   $6.31     8.28%

2019-06-03   TSN        Tyson Foods       $78.06   2019-06-07          $82.45   $4.39     5.62%

2019-03-12    CIEN      CIENA Corp.       $39.79   2019-06-06          $45.49   $5.70     14.33%

2019-05-28    BLL         Ball Corp.           $61.20   2019-06-05          $64.45   $3.25      5.31%


MONEY WAVE BUYS SOON:   

We are currently in 11 logged Open Positions, for the Short & Medium Term.  There are 0 Investments on the Short Term Watch List. 

Be patient and WAIT for Green Zone Buy Signals!

______________________________________________________________________________________________

LONG TERM INVESTMENTS 

Buy the Leading Investments that are down near the weekly Green Zones.   

AES   AES CORP.    Wait for the next Daily Money Wave Buy Signal.   

AU    ANGLOGOLD LTD.     Wait to Buy on a pull back near the Red Line around $12.75.    

CRON   CRONOS GROUP    Wait for a Close above the Red Line of $16.18.   

DXCM   DEXCOM INC.    Buy when it is going to Close above $126.73.     

GRMN   GARMIN LTD.    Wait for a Close above the Red Line of $79.83.   

LLY    ELI LILLY & CO.    Buy when it is going to Close above $119.00.   

QCOM    QUALCOMM INC.    Wait for a Close above the Red Line of $70.50.   

XLNX   XILINX INC.    Wait for a Close above the Red Line of $112.97.   

___________________________________________________________________________________________

Click for  Portfolio (Open Positions)  
Click for  Watch List
Click for  Closed Positions


Alert! Market Risk is MEDIUM (Yellow Zone). The probability of successful Short Term Trades is better, when the % of stocks above the 50-day avg. is below 20. 

Tell your Friends about the Green Line, and Help Animals

___________________________________________________________________________________________

4 Ways to Get your Daily Money Wave Alert:

  • Emailed to your box between 3:30 3:50 pm EDT.
  • Website menu Commentary/Buy/Sell Signals
  • Twitter notifications are the fastest and most reliable  @AboveGreenLine
  • Text messages: Email us your Cell number & phone carrier.


Thank you,

AGL


Posted By AbovetheGreenLine at 1:40 pm 4 Comments Tagged With: premium

Comments

  1. pinellasman says

    June 10, 2019 at 5:47 am

    Good Morning!
    Tammy, why would you buy at the top & sell at the bottom?
    I think it should be just the opposite.
    I don’t understand the chart.
    Peace,
    R

    Log in to Reply
    • AbovetheGreenLine says

      June 10, 2019 at 10:41 am

      Tammy represents most Investors… They Buy High, and Sell Low.

      They Buy on Good News, and Sell on Bad News.

      Don’t be Tammy… She does it all backwards because of her Emotions.

      Her GREED and Lack of Rules causes her to Buy High (Way Above the Green Line).

      Her FEAR causes her to Sell Low because she gets Scared by the media. (And she has a Loss from Buying High on Good News).

      Log in to Reply
  2. pinellasman says

    June 10, 2019 at 10:46 am

    I did not understand the corolation ,

    Peace,
    R

    Log in to Reply
    • AbovetheGreenLine says

      June 10, 2019 at 10:54 am

      Buying Investments Way Above the Green Line is usually a poor bet, because the Investment will eventually return to the Green Line.

      Bonds are Way Above the Green Line, so something will probably happen to cause Bonds to Sell Off towards the Green Line. (Like the Fed Lowering Rates or a China Trade Deal).

      BOND Chart

      Log in to Reply

Leave a Reply Cancel reply

You must be logged in to post a comment.

Voted #1 at Stock Charts

SH Chart
Inverse S&P 500 Fund (SH) will have a Money Wave Buy today.

Help Us Help Animals

Help Us Help Animals

Recent Comments

  • Green Line Weekly Sep 3, 2023 – Omni Legal on Green Line Weekly Sep 3, 2023
  • AbovetheGreenLine on Green Line Weekly Aug 27, 2023
  • lbrodt on Green Line Weekly Aug 27, 2023
  • Mitch Van Zelfden on Money Wave Alert! Jul 31, 2023
  • AbovetheGreenLine on Money Wave Alert! Jul 31, 2023

Become a Green Liner!

Help me make more Money in the Stock Market.

Above the Green Line

ON ATGL

  • Weekly Commentary
  • Intraday Buy / Sells
  • Day Trade Setup

STRATEGIES

  • Swing Trading
  • Dividend Growth
  • ETF Sector Rotation
  • Dogs of the Dow

HELP

  • ATGL Trading Rules
  • FAQ
  • Account Maintenance
  • Contact US

© Copyright 2021 · AboveTheGreenLine.com · All Rights Reserved · Privacy · Terms · Contact · WatchList · Current