
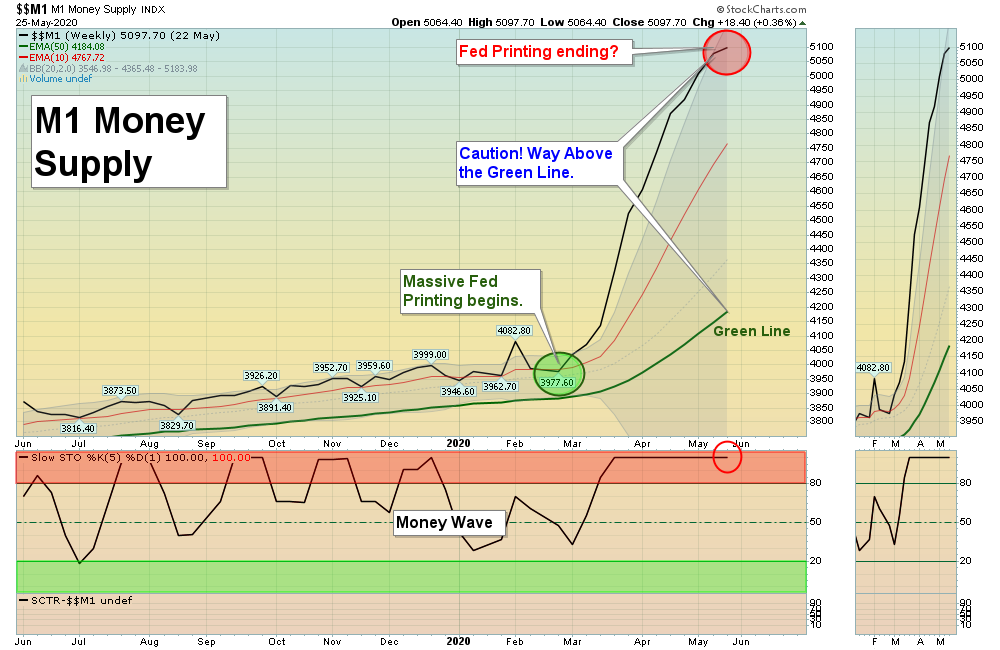
06/07/2020 Markets were up big for the week as the Nasdaq 100 Index went back up to the January Highs, (with the help of Apple). The rally from the March Lows might not see logical, but currently the Markets have gone up two reasons: 1.) Massive FED Printing and 2.) No Alternative Investment (NAI). The FED has added $3 TRILLION and the Stimulus added $2.1 TRILLION. However, the FED won’t Print forever, so the “sugar high” will end (see Chart above).
The Strongest Leaders are now Way Above the Green Lines again, like they were at the January Highs. So the Markets will eventully correct some of the 45% rally since March. If you did not have CASH to Buy when Stocks were Low in March, you might Raise some Cash soon for the next drop. Buying now for the Short Term would normally be a poor Reward / Risk (Smart Money bought in March).
Bonds fell below the Red Line (50-day avg.) this week which means longer term Interest Rates rose. Historically when the Economy improves, Bonds would sell off from Inflation Fears. Then lower prices on Bonds would make them more competitive with Stocks.
For the week the Dow was up 6.78%, the S&P 500 was up 4.94%, and the Nasdaq 100 was up 2.71%. The Long Term Trend for the Indices is up.
The Inflation Index (CRB) was up 5.09% and is Below the Green Line, indicating Economic Weakness.
Bonds were down 4.45% for the week and are Above the Green Line, indicating Economic Weakness.
The US DOLLAR was down 1.47 % for the week.
Crude Oil was up 11.44% for the week at $39.55 and GOLD was down 3.92% at $1683.00.
_____________________________________________________________________________________________
MONEY WAVE BUYS SOON:
We are currently in 1 logged Open Positions, for the Short & Medium Term. There are 6 Investments on the Short Term Watch List.
Be patient and WAIT for Green Zone Buy Signals!
______________________________________________________________________________________________
LONG TERM INVESTMENTS (Most of the Leaders are back up in the Weekly Red Zones.)
Buy the Leading Investments that are down near the Weekly Green Zones.
AUY YAMAHA GOLD Wait for next Daily Green Zone Buy Signal. All time High is $18.50.
DVAX DYNAVAX TECH Wait for next Daily Green Zone Buy Signal. All time High is $23.00.
LLNW LIMELIGHT NETWORKS INC. Buy if it Closes above the Red Line around $5.20 on High Volume.
RRC RANGE RESOURCES CORP. Buy if it Closes above $6.75 on High Volume.
______________________________________________________________________________________
Click for Portfolio (Open Positions)
Click for Watch List
Click for Closed Positions
Dividend Growth Portfolio (we are now posting a Dividend Calendar for the entire portfolio to assist with planning purposes).
ETF Sector Rotation System – Quarterly Rotation was on Apr 1, 2020.
Long Term Strategy for IRAs & 401k Plans:
Alert! Market Risk is HIGH (Red Zone). The probability of successful Short Term Trades is better, when the % of stocks above the 50-day avg. is below 20.
Tell your Friends about the Green Line, and Help Animals
___________________________________________________________________________________________
QUESTION: Nancy writes “I would like to know where the relative strength factor is located on the charts.”
ANSWER: Hi Nancy, the Relative Strength is usually on the bottom left of each Chart with a Red Box around it (SCTR is StockCharts Technical Rank). Sometimes we use data from:
Relative Strength Values comes from the SCTR Rank (StockCharts Technical Rank), www.etfscreen.com for ETFs , and Investor’s Business Daily (IBD) for stocks. We prefer the longer term weighting used by www.etfscreen.com and IBD.
Sometimes look for Big Numbers with circle around them…
Good trading, and tell your friends!


