
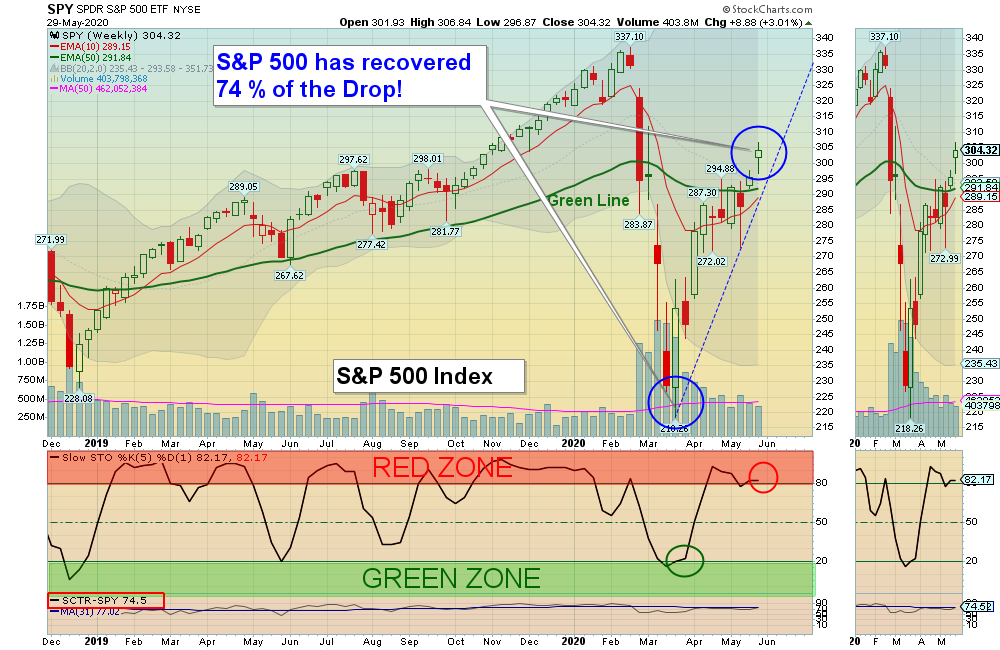
05/31/2020 Markets were up again for the week as the S&P 500 Index pushed higher Above the Green Line. The Nasdaq 100 Index is almost back up to the January Highs, which could be major resistance. The weaker Indices (DOW 30 Index, Small Caps, Transports, & NYSE) are struggling near the Green Lines and could go back down to re-test the March Lows. But currently the Markets are holding up for two reasons: 1.) Massive FED Printing and 2.) No Alternative Investment (NAI).
The Strongest Leaders are now Way Above the Green Lines again, like they were at the January Highs. So the Markets will probably struggle for a while to relieve the Over-Bought condition. Did you have CASH to Buy when Stocks were Low in March? If not, you might Raise some Cash now for the next drop. Otherwise you might not make much more Money this year with the major Indices.
So far Bonds are holding up on the Red Line (50-day avg.). Historically when the Economy improves, Bonds would normally sell off from Inflation Fears. Then lower prices on Bonds would make them more competitive with Stocks. With all of the FED Printing now, Inflation could finally return and confirm why Gold and Gold Mining Funds (GDX) are making New Highs.
For the week the Dow was up 3.84%, the S&P 500 was up 3.01%, and the Nasdaq 100 was up 1.61%. The Long Term Trend for the Indices is mixed.
The Inflation Index (CRB) was up 2.09% and is Below the Green Line, indicating Economic Weakness.
Bonds were down 1.18% for the week and are Above the Green Line, indicating Economic Weakness.
The US DOLLAR was down 1.44 % for the week.
Crude Oil was up 6.74% for the week at $35.49 and GOLD was up 0.93% at $1751.70.
_____________________________________________________________________________________________
MONEY WAVE BUYS SOON:
We are currently in 5 logged Open Positions, for the Short & Medium Term. There are 2 Investments on the Short Term Watch List.
Be patient and WAIT for Green Zone Buy Signals!
______________________________________________________________________________________________
LONG TERM INVESTMENTS (Most of the Leaders are back up in the Weekly Red Zones.)
Buy the Leading Investments that are down near the Weekly Green Zones.
AUY YAMAHA GOLD Wait for next Daily Green Zone Buy Signal. All time High is $18.50.
DVAX DYNAVAX TECH Buy if it Closes above $7.20 on High Volume.
KALA KALA PHARM. Wait for next Daily Green Zone Buy Signal.
LLNW LIMELIGHT NETWORKS INC. Wait for next Daily Green Zone Buy Signal.
RRC RANGE RESOURCES CORP. Buy if it Closes above $6.48 on High Volume.
______________________________________________________________________________________
Click for Portfolio (Open Positions)
Click for Watch List
Click for Closed Positions
NEW DAY TRADE LIST MAY 15, 2020
Dividend Growth Portfolio (we are now posting a Dividend Calendar for the entire portfolio to assist with planning purposes).
ETF Sector Rotation System – Quarterly Rotation was on Apr 1, 2020.
Long Term Strategy for IRAs & 401k Plans:
Alert! Market Risk is HIGH (Red Zone). The probability of successful Short Term Trades is better, when the % of stocks above the 50-day avg. is below 20.
Tell your Friends about the Green Line, and Help Animals
___________________________________________________________________________________________
4 Ways to Get your Daily Money Wave Alert:
- Emailed to your box between 3:30 3:50pm EST.
- Website menu Commentary/Buy/Sell Signals
- Twitter notifications @AboveGreenLine
- Text messages: Email us your Cell number & phone carrier.


