
06/10/2018: Markets were up 1-2 % for the week, as the DOW & S&P 500 Indices are going back up to re-test the Jan Highs. The NASDAQ 100 and Small Caps are back up to the Highs, as they are not hurt by higher Interest Rates like the Big Cap Stocks are.
For the week the Dow rose 2.8%, the Nasdaq rose 1.2%, and the S&P 500 gained 1.2%.
The major Indices need to make Higher Highs soon for this rally to continue, and could re-test the Highs in a month or two. Closing Below the Red Lines would be “Bearish”. The Long Term Trend is UP.
The Inflation Index (CRB) has corrected back down to the Red Line, and is in a mild Up-Trend.
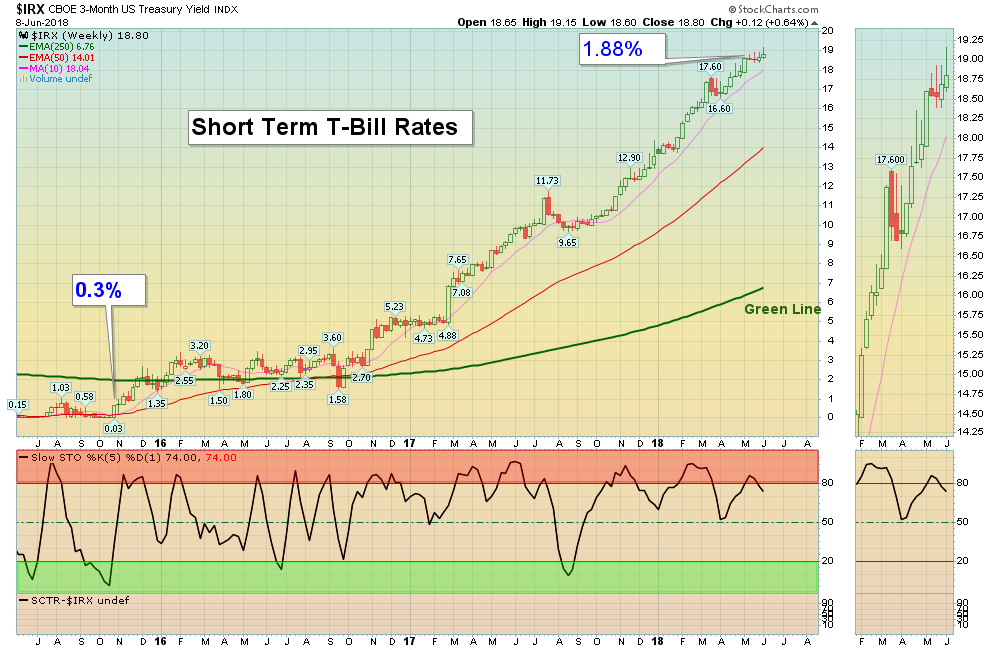
Bonds were down slightly for the week, after Failing at the Green Line and are Bearish.
The US DOLLAR is correcting back down to the Red Line.
Crude Oil was down another 0.11% for the week at $65.75, and GOLD was up 0.26%.
___________________________________________________________________________________________
MONEY WAVE BUYS SOON:
We are currently in 5 logged Open Positions, for the Short & Medium Term. Most of the Leading Investments are back up in the Red Zones. There are 2 Investments on the Short Term Watch List.
Be patient and WAIT for Green Zone Buys!
______________________________________________________________________________________________
LONG TERM TRADES
The Funds below are correcting down to their Green Lines, but the Relative Strength is remaining high. These tend to Bounce nicely when the weekly Money Wave crosses up > 20.
ITB HOME BUILDING FUND Relative Strength is Below 80.
REMX RARE EARTH FUND Wait for Daily Close above $28.62.
SCCO SOUTHERN COPPER Wait for weekly Close Above the Red Line of $51.56 (50-day avg.)
SGMO SANGAMO THERA Wait for a Daily Close above $16.90, then use Green Line as Sell Stop.
WB WEIBO CORP. Wait for weekly Close Above the Red Line (50-day avg.)
___________________________________________________________________________________________
Click for Portfolio (Open Positions)
Click for Watch List
Click for Closed Positions
Alert! Market Risk is Medium (Yellow Zone). The probability of successful Short Term Trades is higher, when the S&P 500 is down near the Green Line.
Tell your Friends about the Green Line, and Help Animals.
QUESTION: Pamela writes ” Could you please tell me how you set up your stop loss…market on close…order on your stocks after you purchase them and if you set them up immediately after purchase?”
ANSWER: Sell Stop Losses are tricky, because the Market Markets tend to go down and Flush out the Stops during the day.
How about setting an Alarm at Support, and then watch the Investment and EXIT if it Keeps dropping.
The Market Makers will sometimes take it down 5-10 cents to “Run the Stops” and then the Investment can end up Holding Support by the Close.
That is why we suggest waiting until the Close (but we have gotten Burned occasionally).
Thank you for writing!


