
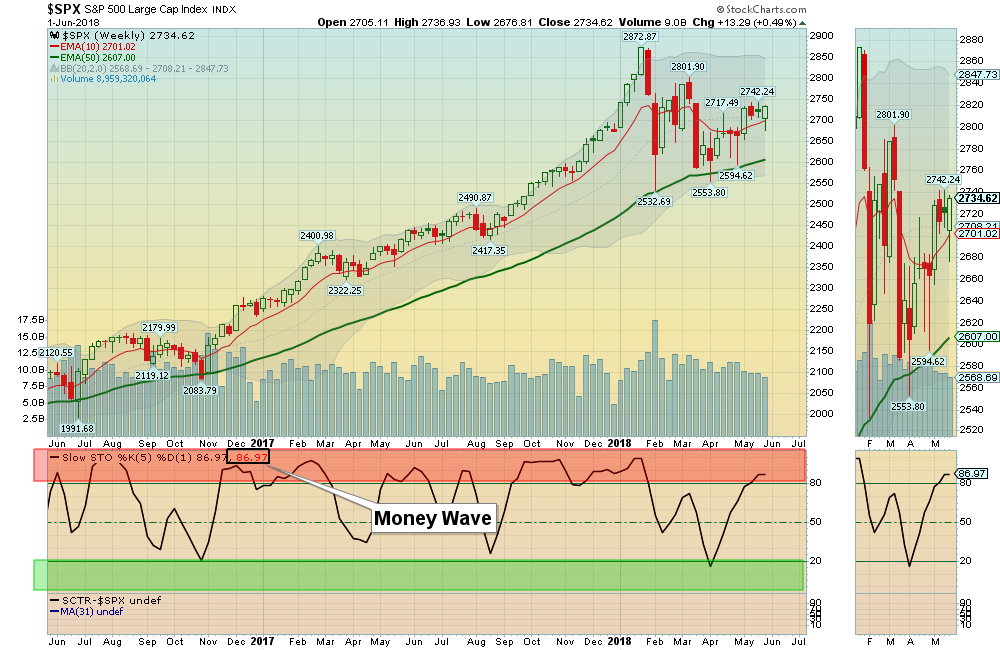
06/03/2018: Markets were up slightly for the week, after the S&P 500 went down and bounced off the Red Line (50-day avg.) For the week, the Dow declined 0.5%, the Nasdaq rose 1.6% and the S&P 500 gained 0.5%.
The major Indices are Above the Red Lines (50-day avgs.) and could re-test the Highs in a month or two. Closing Below the Red Lines would be “Bearish”. The Long Term Trend is UP.
The Strong Energy Sector bounced up from the Green Zones for some Money Wave Buys last week.
The Inflation Index (CRB) is correcting back down to the Red Line, but is in a mild Up-Trend.
Bonds had a another big rally, and were back Above the Green Line for 3 days this week before failing. Is the Economy slowing down?
The US DOLLAR is still strong, but over-bought.
Crude Oil was down another 3.05% for the week at $65.81, and GOLD was down 0.34%.
___________________________________________________________________________________________
MONEY WAVE BUYS SOON:
We are currently in 5 logged Open Positions, for the Short & Medium Term. Most of the Leading Investments are back up in the Red Zones. There are 3 Investments on the Short Term Watch List.
Be patient and WAIT for Green Zone Buys!
______________________________________________________________________________________________
LONG TERM TRADES
The Funds below are correcting down to their Green Lines, but the Relative Strength is remaining high. These tend to Bounce nicely when the weekly Money Wave crosses up > 20.
ITB HOME BUILDING FUND Wait for Daily Close above $39.61.
REMX RARE EARTH FUND Wait for Daily Close above $28.62.
SCCO SOUTHERN COPPER Wait for Weekly Money Wave Buy > 20.
SGMO SANGAMO THERA Wait for a Daily Close above $16.60, then use Green Line as Sell Stop. (Closed at $16.60 on Friday).
TCEHY TENCENT HOLDINGS Wait for next Daily Money Wave Buy > 20.
WB WEIBO CORP. Wait for weekly Close Above the Red Line (50-day avg.)
___________________________________________________________________________________________
Click for Portfolio (Open Positions)
Click for Watch List
Click for Closed Positions
Alert! Market Risk is Medium (Yellow Zone). The probability of successful Short Term Trades is higher, when the S&P 500 is down near the Green Line.
Tell your Friends about the Green Line, and Help Animals.
QUESTION: “I am puzzled by the SGMO SANGAMO THERA buy recommendation as the SCTR score is only 37.5?”
ANSWER: Thank you for writing. The SCTR rank from Stock Charts is weighted too much to the last 90 days of trading. We prefer the longer term Relative Strength from Investor’s Business Daily or http://www.etfscreen.com.
But the Relative Strength of SGMO at IBD is still only 80. (Also there are 2 values of SCTR on StockCharts’ Chart… The lower one is a 155 day moving average which is 84. Please use that one).
We will probably amend the Rules on Long Term Trading to only 80 R S, as very few Investments stay up at 90 R S after correcting down to the Green Line.


