Above the Green Line -01
  • Market Insights
        • Commentary
          • Daily
          • Weekly
        • BUY / SELL SIGNALS
          • Trade Posts
          • Recent Trade Alerts
          • Recent Day Trades
        • BLOGROLL
          • Dividend Growth Blog
          • ETF Sector Blog
          • Dow Dogs
          • TPOW Blog
  • Strategies
        • SWING TRADING
          • Current Positions
          • Watchlists
          • Closed Positions
          • Candidates - TOP 100
          • Specialty Stocks
        • WEEKLY STOCK PICK
          • TPOW Charts
          • TPOW Performance
          • TPOW Strategy Guide
          • TPOW Performance Dashboard
        • DAY TRADING
          • Watch List
        • ATGL DASHBOARD
        • ETF STRATEGIES
          • ETF Sector Rotation
          • ETF Sector Portfolio
        • DIVIDEND GROWTH
          • Dividend Growth Portfolio
          • Dividend Calendar
        • DOGS OF THE DOW
          • Dogs of the Dow Portfolio
          • DOW 5 Portfolio
  • Markets
        • US MARKET
          • Commodities
          • Energy
          • Precious Metals
          • Volatility
        • GLOBAL MARKETS
          • Market Indices
          • Economic Calendar
          • FOREX Heat Map
          • FOREX Cross Rates
          • Crypto Currency Market
  • Investing
    • Discord Community
    • Dashboard
  • Resources
        • ARTICLES
          • Dividend Growth Model Articles
          • ETF Articles
          • Investment Strategies Articles
          • Market and Economic Insights
          • Stock Trade Articles
          • Stock Reviews
        • TOOLS
          • Stock Scanners
          • Charting Software
          • Brokerage Firms
        • STOCK CHARTS
          • Key Components
          • Reading Charts
          • Drawing Stock Charts
          • Identifying Trends
        • RETIREMENT PLANNING
  • About
    • Contact Us
    • How to Win
    • #1 At Stockcharts
    • Disclaimer
    • FAQ
  • Log In
  • Subscribe

July 5, 2021

Green Line Weekly – Jul 5, 2021

SPX Chart
The S&P 500 Index is now 14.7 % Above the Green Line.

7/05/2021 Markets were up again for the week as the S&P 500 & NASDAQ 100 Indices both made New Highs. But the DOW 30 and Small Caps Indices are now weaker. Money is not leaving the Markets, as the FED has promised that they will continue Buying $120 BILLION of Debt monthly until next year. So many Investors see no FEAR and will not Sell..

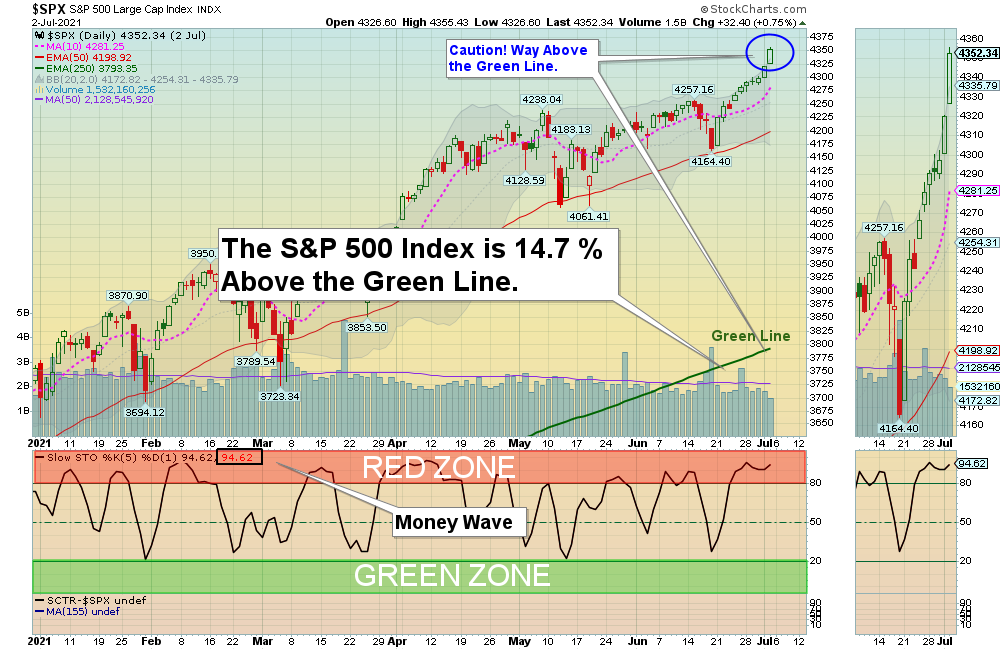
So now we should measure the Reward / Risk of being in the Markets for the Short Term. The S&P 500 is currently 14.7 % Above the Green Line (and it will eventually return to the Green Line). Before Buying any Investment, your goal should be to have at least a 2 : 1 Reward / Risk ratio. Therefore the S&P would have to go up another 29.4 % later this year,  to justify the 14.7 % downside risk of a normal pull back to the Green Line.  Are you betting on another 29.4 % rally later this year?

This lack of Selling has made it harder for us to make much Money lately using the Green Line System, That is because the Markets are not pulling back, as the HERD has no discipline and is becoming Fully Invested. But that will change. The HERD is complacent and not Selling. We like to Buy when the HERD is SCARED and panic Selling…

For the week the Dow was up 1.01%, the S&P 500 was up 1.67%, and the Nasdaq 100 was up 2.63%. The Long Term Trend for the Indices is up.  

The Inflation Index (CRB) was up 2.16% for the week and is Above the Green Line, indicating Economic Expansion.

Bonds were up 2.27 % for the week, and are Below the Green Line, indicating Economic Expansion.

The US DOLLAR was up 0.62% for the week. 

Crude Oil was up 1.50% for the week at $75.16 (a New High) and GOLD was up 0.31%  at $1783.30.

SEE SUPPLEMENTAL CHARTS

_____________________________________________________________________________________________

MONEY WAVE BUYS SOON

We are currently in only 2 logged Current Positions, for the Short & Medium Term.  There are  9 investments on the Short Term Watch List. 

Be patient and WAIT for Green Zone Buy Signals!

______________________________________________________________________________________________

LONG TERM INVESTMENTS  (Many Leaders have pulled back , but Markets are near Highs.)

SCROLLING Charts (Real Time)

KIRK      KIRKLAND’S INC.       Buy if it Closes above the Red Line (50-day avg.) with High Volume.       
RIOT      RIOT BLOCKCHAIN      Buy the next Daily Money Wave Buy Signal with High Volume.   
TRIP      TRIPADVISOR INC.    Buy if it Closes above the Red Line (50-day avg.) with High Volume.       
ZKIN       ZK INT’L. GROUP      Buy if it Closes above the Red Line (50-day avg.) with High Volume.

______________________________________________________________________________________

My Trading Dashboard

Click for  Watch Lists
Click for  Current Positions
Click for  Closed Positions

Day Trading Scrolling Charts
UPDATED  Top 100 List Jul 5, 2021
Dividend Growth Portfolio  
ETF Sector Rotation System      
Dogs of the DOW System
Long Term Strategy for IRAs & 401k Plans
CNN Fear & Greed Index
Scrolling Stage Chart Investing Charts

Alert! Market Risk is MEDIUM (Yellow Zone). The probability of successful Short Term Trades is better, when the % of stocks above the 50-day avg. is below 20. 

Tell your Friends about the Green Line, and Help Animals.

___________________________________________________________________________________________

4 Ways to Get your Daily Money Wave Alert:

  • Emailed to your box between 3:40 3:50 pm EST.
  • Website menu Commentary/Buy/Sell Signals
  • Twitter notifications are the fastest @AboveGreenLine
  • Text messages: Email us your Cell number & phone carrier.

Thank you,

ATGL

Related Post

– Green Line Weekly Jun 27, 2021

Subscribe to Our Newsletter

AGL Logo

Get our eBook Now!

Candlestick - A Swing Traders Friend

We don’t spam! Read our privacy policy for more info.

You’ve been successfully subscribed to our newsletter!

Voted #1 at Stock Charts

SH Chart
Inverse S&P 500 Fund (SH) will have a Money Wave Buy today.

Help Us Help Animals

Help Us Help Animals

Recent Comments

  • Market Breadth Indicators: A Trader’s Guide to Early Trend Detection on Backtesting: Definition and How a Trading Strategy Backtest Works
  • Island Reversal Pattern: Definition and Formation Explained on Double Top Pattern: How to Identify and Trade This Reversal Signal
  • Channel Pattern Guide: What It Is and Why It Matters on A Guide to Forecasting Using Moving Averages
  • What Is a Broadening Bottom Chart Pattern? Full Guide on Bull vs. Bear Market: An Investor’s Guide to Market Phases
  • ATGL Weekly Money Flow - 2025-05-11 on ATGL Top Pick of the Week! Apr 6, 2025

Become a Green Liner!

Help me make more Money in the Stock Market.

ON ATGL

  • DashBoard
  • Weekly Commentary
  • Daily Buy / Sell Signals
  • Day Trade Setup
  • Trading Rooms

Design & Develop By Pixelvect

STRATEGIES

  • Swing Trading
  • ATGL Pick of the Week
  • Dividend Growth
  • ETF Sector Rotation
  • Dogs of the Dow

HELP

  • ATGL Trading Rules
  • FAQ
  • Account Maintenance
  • Contact US
  • Join

FOLLOW US

Instagram Linkedin Twitter Facebook

© COPYRIGHT 2024 · ABOVETHEGREENLINE.COM · ALL RIGHTS RESERVED · PRIVACY · TERMS · CONTACT · WATCHLIST · CURRENT