Above the Green Line -01
  • Market Insights
        • Commentary
          • Daily
          • Weekly
        • BUY / SELL SIGNALS
          • Trade Posts
          • Recent Trade Alerts
          • Recent Day Trades
        • BLOGROLL
          • Dividend Growth Blog
          • ETF Sector Blog
          • Dow Dogs
          • TPOW Blog
  • Strategies
        • SWING TRADING
          • Current Positions
          • Watchlists
          • Closed Positions
          • Candidates - TOP 100
          • Specialty Stocks
        • WEEKLY STOCK PICK
          • TPOW Charts
          • TPOW Performance
          • TPOW Strategy Guide
          • TPOW Performance Dashboard
        • DAY TRADING
          • Watch List
        • ATGL DASHBOARD
        • ETF STRATEGIES
          • ETF Sector Rotation
          • ETF Sector Portfolio
        • DIVIDEND GROWTH
          • Dividend Growth Portfolio
          • Dividend Calendar
        • DOGS OF THE DOW
          • Dogs of the Dow Portfolio
          • DOW 5 Portfolio
  • Markets
        • US MARKET
          • Commodities
          • Energy
          • Precious Metals
          • Volatility
        • GLOBAL MARKETS
          • Market Indices
          • Economic Calendar
          • FOREX Heat Map
          • FOREX Cross Rates
          • Crypto Currency Market
  • Investing
    • Discord Community
    • Dashboard
  • Resources
        • ARTICLES
          • Dividend Growth Model Articles
          • ETF Articles
          • Investment Strategies Articles
          • Market and Economic Insights
          • Stock Trade Articles
          • Stock Reviews
        • TOOLS
          • Stock Scanners
          • Charting Software
          • Brokerage Firms
        • STOCK CHARTS
          • Key Components
          • Reading Charts
          • Drawing Stock Charts
          • Identifying Trends
        • RETIREMENT PLANNING
  • About
    • Contact Us
    • How to Win
    • #1 At Stockcharts
    • Disclaimer
    • FAQ
  • Log In
  • Subscribe

January 30, 2022

Green Line Weekly Jan 30, 2022

SPX Chart
The S&P 500 might not exceed the Highs when the FED quits Printing.

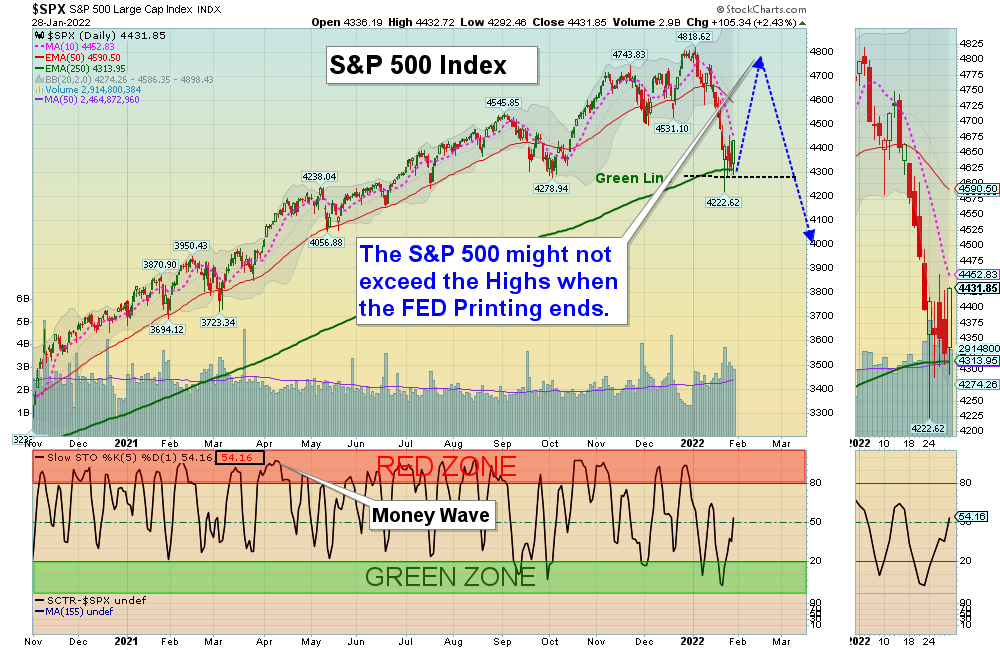
1/30/2022 Markets were mixed for the week after the Indices dumped down earlier on Monday. The Indices returned back down to the Green Lines (like they always do), but the weaker Small Caps and NASDAQ 100 are still Below the Green Lines . The Markets are discounting the Tapering of the massive Printing that FED has been doing which gave the Markets a “sugar high”. 

The FEAR is High now, and that is when we like to Buy. We have bet (based on history and upward momentum) that the S&P 500 Index will bounce up off the Green Line in the next few weeks to re-test the High. Then if the S&P 500 cannot make New Highs, heavy Selling could come in.  Many Investments are now Below the Green Lines, and they might not bounce up as well as the Leaders that are still Above the Green Lines + Above 90 Relative Strength.

If you continue to Follow the Green Line System, your Money should flow into the Strongest areas and your account value should be able to grow in both Bull and Bear Markets.     

There has been plenty of action on the Day Trading Scrolling Charts.  

DAY TRADING CHARTS FOR INDICES & LARGE CAPS.

We have not had many intra-day Stocks Alerts lately as the Volume has been too Low on Buy Signals. We like to see High Volume on rallies.

For the week the Dow was up 1.39%, the S&P 500 was up 0.91%, and the NASDAQ 100 was up 0.03%. The Long Term Trend for the Indices is up. 

The Inflation Index (CRB) was up 1.76% for the week (a New High) and is Above the Green Line, indicating Economic Expansion.

Bonds were down 0.35% for the week, and are Below the Green Line, indicating Economic Expansion.

The US DOLLAR was up 1.70% for the week (a New High) and is Above the Green Line. 

Crude Oil was up 1.97% for the week at $86.82 and GOLD was up 2.47%  at $1831.80. 

SEE SUPPLEMENTAL CHARTS

_____________________________________________________________________________________________

MONEY WAVE BUYS SOON

We are only in 10 logged Current Positions, for the Short & Medium Term.  There are 4 investments on the Short Term Watch List. 

Be patient and WAIT for Green Zone Buy Signals!

_________________________________________________________________________________________

LONG TERM INVESTMENTS  (many Large Caps no longer have 80 Relative Strength required.)

Long Term Scrolling Charts (Real Time)   

BX      BLACKSTONE GROUP      Shot up 14 % this week. Buy if it Closes above $124.39 with High Volume.   

COST      COSTCO WHOLESALE    Wait for Weekly Money Wave Close > 20 with High Volume.

DKS      DICKS SPORTING GOODS      Buy if it Closes above $118.25 with High Volume.

NVDA      NVIDIA CORP.      Wait for Weekly Money Wave Close > 20 with High Volume.

QQQ       NASDAQ 100 Fund      Wait for a Close Above the Green Line.     

XLK      TECH FUND      Wait for the next Daily Money Wave Buy Signal with High Volume.

XLRE      REAL ESTATE FUND      Wait for Weekly Money Wave Close > 20 with High Volume.

________________________________________________________________________________

My Trading Dashboard
Swing Trading Scrolling Charts
Day Trading Scrolling Charts

Click for  Watch Lists
Click for  Current Positions
Click for  Closed Positions

Updated Top 100 List Jan 1, 2022
Dividend Growth Portfolio  
ETF Sector Rotation System      
Dogs of the DOW System
Long Term Strategy for IRAs & 401k Plans
CNN Fear & Greed Index
Scrolling Stage Chart Investing Charts

Alert! Market Risk is LOW (Green Zone). The probability of successful Short Term Trades is better, when the % of stocks above the 50-day avg. is below 20. 

Tell your Friends about the Green Line, and Help Animals.

________________________________________________________________________________

4 Ways to Get your Daily Money Wave Alert:

    • Emailed to your box between 3:40 3:50 pm EST.
    • Website menu Commentary/Buy/Sell Signals
    • Twitter notifications are the fastest @AboveGreenLine
    • Text messages: Email us your Cell number & phone carrier.

Thank you,

ATGL

Related Post

– Green Line Weekly Jan 23, 2022

Subscribe to Our Newsletter

AGL Logo

Get our eBook Now!

Candlestick - A Swing Traders Friend

We don’t spam! Read our privacy policy for more info.

You’ve been successfully subscribed to our newsletter!

Voted #1 at Stock Charts

SH Chart
Inverse S&P 500 Fund (SH) will have a Money Wave Buy today.

Help Us Help Animals

Help Us Help Animals

Recent Comments

  • Market Breadth Indicators: A Trader’s Guide to Early Trend Detection on Backtesting: Definition and How a Trading Strategy Backtest Works
  • Island Reversal Pattern: Definition and Formation Explained on Double Top Pattern: How to Identify and Trade This Reversal Signal
  • Channel Pattern Guide: What It Is and Why It Matters on A Guide to Forecasting Using Moving Averages
  • What Is a Broadening Bottom Chart Pattern? Full Guide on Bull vs. Bear Market: An Investor’s Guide to Market Phases
  • ATGL Weekly Money Flow - 2025-05-11 on ATGL Top Pick of the Week! Apr 6, 2025

Become a Green Liner!

Help me make more Money in the Stock Market.

ON ATGL

  • DashBoard
  • Weekly Commentary
  • Daily Buy / Sell Signals
  • Day Trade Setup
  • Trading Rooms

Design & Develop By Pixelvect

STRATEGIES

  • Swing Trading
  • ATGL Pick of the Week
  • Dividend Growth
  • ETF Sector Rotation
  • Dogs of the Dow

HELP

  • ATGL Trading Rules
  • FAQ
  • Account Maintenance
  • Contact US
  • Join

FOLLOW US

Instagram Linkedin Twitter Facebook

© COPYRIGHT 2024 · ABOVETHEGREENLINE.COM · ALL RIGHTS RESERVED · PRIVACY · TERMS · CONTACT · WATCHLIST · CURRENT