
2/6/2022 Markets were higher for the week after the Stronger Indices were able to bounce up off the Green Lines. Most likely the bounce up off the Green Line will have 5 Waves (3 up waves and 2 down waves) and the pull-back for the last few days is Wave 2 down. Then we could have a powerful Wave 3 up. The weaker Small Cap Index and Treasury Bonds are still Below the Green Lines. The Markets are discounting the Tapering of the massive Printing that FED has been doing which gave the Markets a “sugar high”.
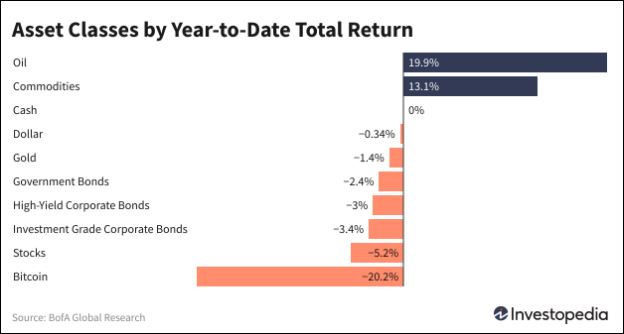
Some Investors are frustrated because it has been harder to make Money in the Markets so far this year. Last year when the FED was Printing at full speed, we warned you that Smart Money would eventually move from historically High Priced Stocks and Bonds (where the Herd was loaded up), to Tangible Investments (see Chart above). Commodities are currently over-bought, and FED tightening soon could cause them to correct. But the Commodity Index (CRB) is still down 45% from the 2008 Highs, and will probably return to the Highs again.
If you continue to Follow the Green Line System, your Money should flow into the Strongest areas and your account value should be able to grow in both Bull and Bear Markets.
Profits made on this latest Swing Trading Buy Cycle:
AEHR AEHR TEST SYSTEMS Sold on the Close at $13.14 for a 13.77 % Gain.
HPQ HEWLETT PACKARD Target Hit at $38 for an 8.6 % Gain.
WFC WELLS FARGO & CO. Target Hit at $57 for a 6.4 % Gain.
There has been plenty of action on the Day Trading Scrolling Charts.
DAY TRADING CHARTS FOR INDICES & LARGE CAPS.
We have not had many intra-day Stocks Alerts lately as the Volume has been too Low on Buy Signals. We like to see High Volume on rallies.
For the week the Dow was up 1.08%, the S&P 500 was up 1.53%, and the NASDAQ 100 was up 1.77%. The Long Term Trend for the Indices is up.
The Inflation Index (CRB) was up 3.34% for the week (a New High) and is Above the Green Line, indicating Economic Expansion.
Bonds were down 2.74% for the week, and are Below the Green Line, indicating Economic Expansion.
The US DOLLAR was down 1.84% for the week and is Above the Green Line.
Crude Oil was up 6.32% for the week at $92.31 and GOLD was up 1.19% at $1807.80.
_____________________________________________________________________________________________
MONEY WAVE BUYS SOON
We are in 6 logged Current Positions, for the Short & Medium Term. There are only 2 investments on the Short Term Watch List.
Be patient and WAIT for Green Zone Buy Signals!
_________________________________________________________________________________________
LONG TERM INVESTMENTS (many Large Caps no longer have 80 Relative Strength required.)
Long Term Scrolling Charts (Real Time)
BX BLACKSTONE GROUP Shot up 7.58% this week. Bought above $123.33 (adj. for Div.)
COST COSTCO WHOLESALE Weekly Money Wave Buy, but the Volume was not High. Avoid.
DKS DICKS SPORTING GOODS Buy if it Closes above $118.25 with High Volume.
F FORD MOTOR CO. Wait for Weekly Money Wave Close > 20 with High Volume.
NVDA NVIDIA CORP. Wait for Weekly Money Wave Close > 20 with High Volume.
QQQ NASDAQ 100 Fund Wait for Weekly Money Wave Close > 20 with High Volume.
XLK TECH FUND Wait for the next Daily Money Wave Buy Signal with High Volume.
XLRE REAL ESTATE FUND Wait for Weekly Money Wave Close > 20 with High Volume.
________________________________________________________________________________
My Trading Dashboard
Swing Trading Scrolling Charts
Day Trading Scrolling Charts
Click for Watch Lists
Click for Current Positions
Click for Closed Positions
Updated Top 100 List Feb 1, 2022
Dividend Growth Portfolio
ETF Sector Rotation System
Dogs of the DOW System
Long Term Strategy for IRAs & 401k Plans
CNN Fear & Greed Index
Scrolling Stage Chart Investing Charts
Alert! Market Risk is LOW (Green Zone). The probability of successful Short Term Trades is better, when the % of stocks above the 50-day avg. is below 20.
Tell your Friends about the Green Line, and Help Animals.
________________________________________________________________________________
QUESTION: Jackie writes “Been reading your informative articles and FAQs. Is there a way I can enter a stock such as BA or an ETF symbols and see them shown as ATGL chart with red/green zones, MAs, sector ranking, Green Line etc?”
ANSWER: Yes. Near the bottom of each Daily email, look for: ARE YOUR INVESTMENTS ABOVE THE GREEN LINE?
Please Click on the link (To make the Chart larger, please change the SIZE to Landscape and then Update.)
Good trading and tell your friends!
