Above the Green Line -01
  • Market Insights
        • Commentary
          • Daily
          • Weekly
        • BUY / SELL SIGNALS
          • Trade Posts
          • Recent Trade Alerts
          • Recent Day Trades
        • BLOGROLL
          • Dividend Growth Blog
          • ETF Sector Blog
          • Dow Dogs
          • TPOW Blog
  • Strategies
        • SWING TRADING
          • Current Positions
          • Watchlists
          • Closed Positions
          • Candidates - TOP 100
          • Specialty Stocks
        • WEEKLY STOCK PICK
          • TPOW Charts
          • TPOW Performance
          • TPOW Strategy Guide
          • TPOW Performance Dashboard
        • DAY TRADING
          • Watch List
        • ATGL DASHBOARD
        • ETF STRATEGIES
          • ETF Sector Rotation
          • ETF Sector Portfolio
        • DIVIDEND GROWTH
          • Dividend Growth Portfolio
          • Dividend Calendar
        • DOGS OF THE DOW
          • Dogs of the Dow Portfolio
          • DOW 5 Portfolio
  • Markets
        • US MARKET
          • Commodities
          • Energy
          • Precious Metals
          • Volatility
        • GLOBAL MARKETS
          • Market Indices
          • Economic Calendar
          • FOREX Heat Map
          • FOREX Cross Rates
          • Crypto Currency Market
  • Investing
    • Discord Community
    • Dashboard
  • Resources
        • ARTICLES
          • Dividend Growth Model Articles
          • ETF Articles
          • Investment Strategies Articles
          • Market and Economic Insights
          • Stock Trade Articles
          • Stock Reviews
        • TOOLS
          • Stock Scanners
          • Charting Software
          • Brokerage Firms
        • STOCK CHARTS
          • Key Components
          • Reading Charts
          • Drawing Stock Charts
          • Identifying Trends
        • RETIREMENT PLANNING
  • About
    • Contact Us
    • How to Win
    • #1 At Stockcharts
    • Disclaimer
    • FAQ
  • Log In
  • Subscribe

February 17, 2019

Green Line Weekly Feb 17, 2019

SPX Weekly
The S&P 500 is up 18% in 7 weeks.


The Big Picture for 2019

Wow! Markets just rallied 18% in 7 weeks from the Dec Lows. That is more than 7 of the last 10 years of this Bull Market. While Earnings improved considerably during the last 10 year Bull, much of the rally was from the FED printing historical amounts of Money. The Fed printing is over, and we now have $22 Trillion on Debt (US DEBT Clock).

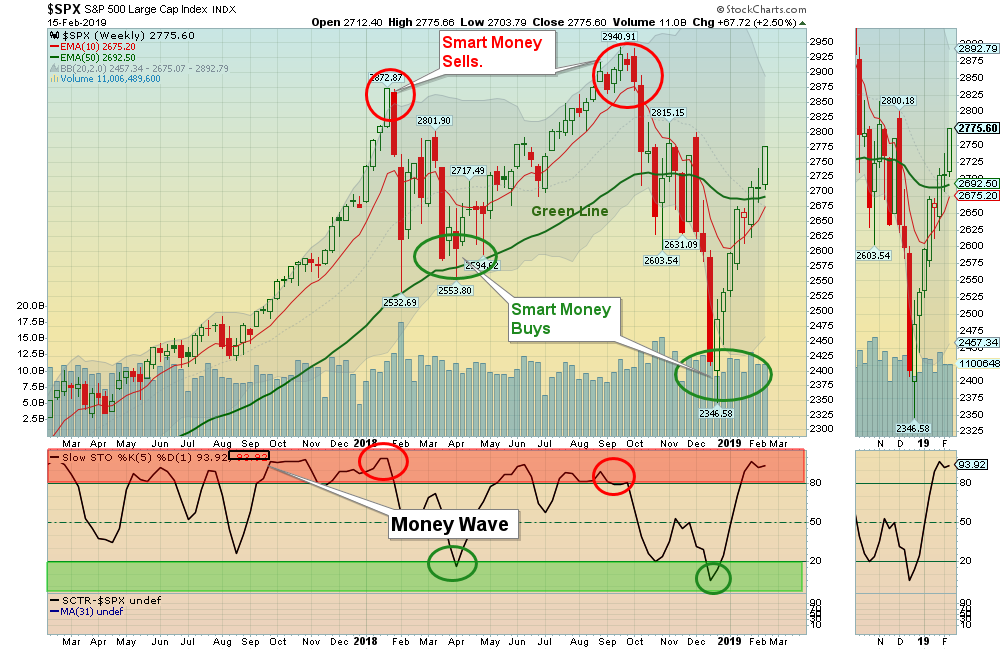
So if you plan to Buy & Hold and continue to make good money like over the last 10 years, you will probably become very frustrated. There is not an UNLIMITED amount of Money to go into Stocks Markets. and the FED is no longer Buying, and Insiders are mostly Selling. So if the Markets are now at Equilibrium (same amount of Buyers & Sellers) then Market Timing might be your answer. The Solution for many and the 401K type Investor might be to only Buy in the Green Zone of this Chart, and take profits in the Red Zone.

02/17/2019:  Markets  were up big for the week as Good News poured in. So Tammy panic Sold in Dec. on Bad News, and is now hopping back in on Good News? Remember, Smart Money Buys on Bad News, and Sells on Good News. 

For the week the Dow was up 3.09%, the S&P 500 was up 2.55%, and the Nasdaq 100 was up 2.05%.   The very Long Term Trend on the Stock Markets is UP.  Now all of the major US Indices are back Above the Green Lines. Stocks still do not have a real competing Investment yet, other than CDs at the Bank.


The Inflation Index (CRB) was up 1.85% and is Below the Green Line, indicating Economic Weakness.

Bonds  were down 0.30% for the week and are Above the Green Line, indicating Economic Weakness.

The US DOLLAR  was up 0.27%, and is over-bought again.

Crude Oil was up 6.18% for the week at $55.98, and GOLD was up 0.27% at $1322.

___________________________________________________________________________________________

MONEY WAVE BUYS SOON:   

We are currently in 5 logged Open Positions, for the Short & Medium Term.  There are 3 Investments on the Short Term Watch List. 

Be patient and WAIT for Green Zone Buy Signals!

______________________________________________________________________________________________

LONG TERM TRADES 

Many of the Strongest Investments that bounced up off the Green Line with Above 80 Relative Strength, are now getting back into their Red Zones on the weekly charts (Danger Zone).

   
AVP    AVON PRODUCTS     Buy when it Closes above $2.99.
FTNT     FORTINET, INC.     Wait for the next Daily Money Wave Buy Signal.  
GNW    GENWORTH FINANCIAL     Buy if it Closes above $5.27. 
LW    LAMB WESTON HOLDINGS    Buy if it Closes above $71.81.
PFE    PFIZER, INC.    Wait for the next Daily Money Wave Buy Signal. 
UAL    UNITED CON’T. AIR     Wait for the next Daily Money Wave Buy Signal.     
VER    VEREIT, INC.    Wait for the next Daily Money Wave Buy Signal.  (7% Dividend)
   

___________________________________________________________________________________________


Click for  Portfolio (Open Positions)  
Click for  Watch List
Click for  Closed Positions


Alert! Market Risk is HIGH (Red Zone). The probability of successful Short Term Trades is better, when the % of stocks above the 50-day avg. is below 20. 

Tell your Friends about the Green Line, and Help Animals.

Related Post

– Green Line Weekly Feb 10, 2019

Subscribe to Our Newsletter

AGL Logo

Get our eBook Now!

Candlestick - A Swing Traders Friend

We don’t spam! Read our privacy policy for more info.

You’ve been successfully subscribed to our newsletter!

Voted #1 at Stock Charts

SH Chart
Inverse S&P 500 Fund (SH) will have a Money Wave Buy today.

Help Us Help Animals

Help Us Help Animals

Recent Comments

  • Market Breadth Indicators: A Trader’s Guide to Early Trend Detection on Backtesting: Definition and How a Trading Strategy Backtest Works
  • Island Reversal Pattern: Definition and Formation Explained on Double Top Pattern: How to Identify and Trade This Reversal Signal
  • Channel Pattern Guide: What It Is and Why It Matters on A Guide to Forecasting Using Moving Averages
  • What Is a Broadening Bottom Chart Pattern? Full Guide on Bull vs. Bear Market: An Investor’s Guide to Market Phases
  • ATGL Weekly Money Flow - 2025-05-11 on ATGL Top Pick of the Week! Apr 6, 2025

Become a Green Liner!

Help me make more Money in the Stock Market.

ON ATGL

  • DashBoard
  • Weekly Commentary
  • Daily Buy / Sell Signals
  • Day Trade Setup
  • Trading Rooms

Design & Develop By Pixelvect

STRATEGIES

  • Swing Trading
  • ATGL Pick of the Week
  • Dividend Growth
  • ETF Sector Rotation
  • Dogs of the Dow

HELP

  • ATGL Trading Rules
  • FAQ
  • Account Maintenance
  • Contact US
  • Join

FOLLOW US

Instagram Linkedin Twitter Facebook

© COPYRIGHT 2024 · ABOVETHEGREENLINE.COM · ALL RIGHTS RESERVED · PRIVACY · TERMS · CONTACT · WATCHLIST · CURRENT