
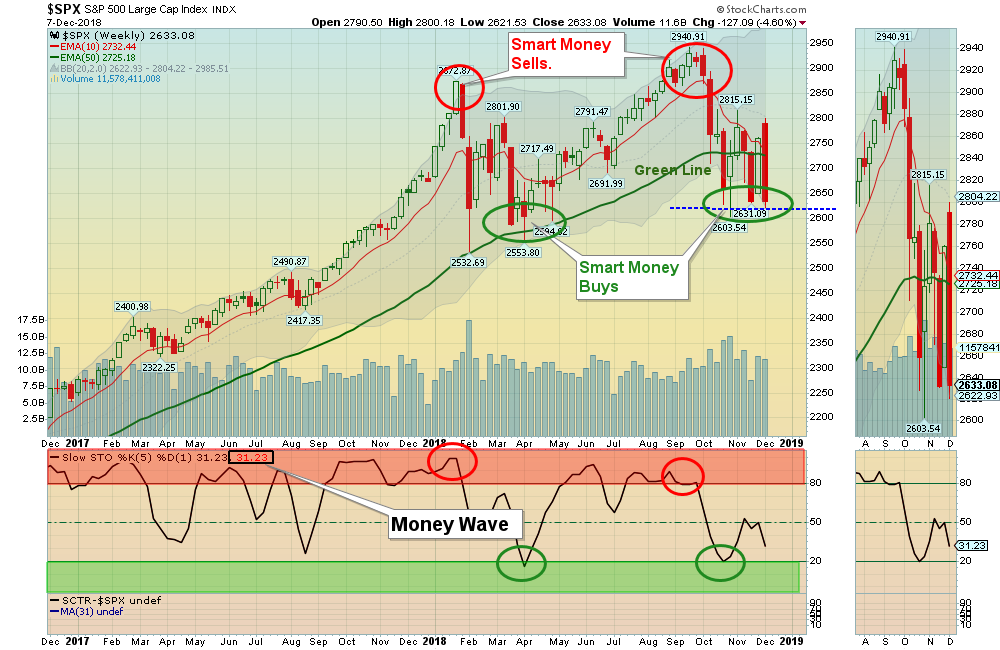
12/09/2018: Markets were down BIG for the week, as the Indexes went up above the Red Lines temporarily (50-day avgs.) to suck in a lot of Buying. Then Selling began, but the Volume was not high. Support on the S&P 500 is around 2603.
The Strongest Leaders that are holding Above the Green Lines could go back up to re-test the September Highs (see Long Term List below).
For the week the Dow was down 5.16%, the S&P 500 was down 4.60%, and the Nasdaq 100 was down 4.83%. The Long Term Trend on the Stock Markets is UP.
Bonds were up 2.91% for the week and are Above the Green Line, indicating Economic Weakness. Yield on the 10-Year Note has dropped from 3.25% to 2.85%, which should help the Housing Market.
The Inflation Index (CRB) was up 1.33% and is Below the Green Line, indicating Economic Weakness.
The US DOLLAR was down 0.46%, and is currently over-bought.
Crude Oil was up 3.30% for the week at $52.61, and GOLD was up to $1252.60.
___________________________________________________________________________________________
MONEY WAVE BUYS SOON:
We are currently in 5 logged Open Positions, for the Short & Medium Term. There are 5 Investments on the Short Term Watch List.
Be patient and WAIT for Green Zone Buy Signals!
______________________________________________________________________________________________
LONG TERM TRADES
Investments below that can Bounce up off the Green Line with Above 80 Relative Strength, could re-test their recent Highs.
ADBE ADOBE SYSTEMS Wait for the next Daily Money Wave Buy.
AMZN AMAZON.COM Wait for the next Daily Money Wave Buy.
ARWR ARROWHEAD PHARMA. Wait for the next Daily Money Wave Buy.
FOSL FOSSIL GROUP Place Buy Stop Order above $24.28 on the Close.
FTNT FORTINET INC. Wait for next Daily Money Wave Buy.
LULU LULULEMON ATHLETICA Wait for Daily Money Wave Buy.
OKTA OKTA, INC. Wait for the next Daily Money Wave Buy.
RUN SUNRUN, INC Wait for the next Daily Money Wave Buy.
WWE WORLD WRESTLING Wait for the next Daily Money Wave Buy.
___________________________________________________________________________________________
Click for Portfolio (Open Positions)
Click for Watch List
Click for Closed Positions
Alert! Market Risk is MEDIUM (Yellow Zone). The probability of successful Short Term Trades is better, when the S&P 500 is down near the Green Line.
Tell your Friends about the Green Line, and Help Animals.
QUESTION: Brian writes ” Is there anyway to make your strategy work in the German markets or the forex game. Like things without sctr values?”
ANSWER: Yes Brian, the Green Line System works with ALL Investments and Mutual Funds that can be Charted.
If there is no Symbol, you can manually make a Chart like we did before computers existed. Make sure the Investment stays Above the Green Line (250 day ema).
Determining Relative Strength would be trickier. Most Relative Strength systems use computers to compare the Investment to the S&P 5oo index, or to all Investments that are in the database.


