
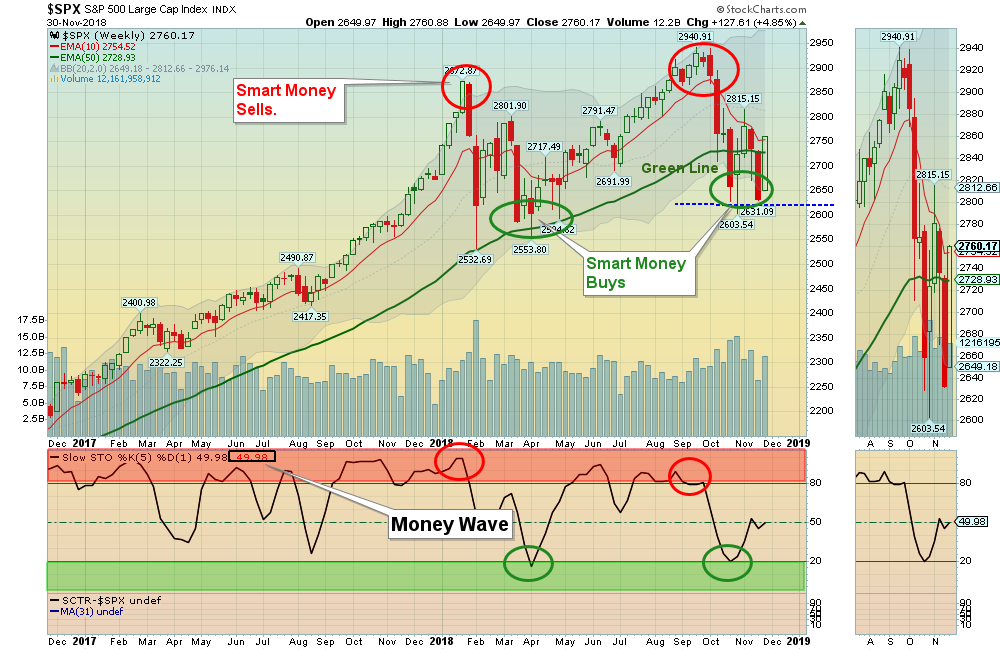
12/02/2018: Markets popped up BIG for the week, as the Indexes bounced up from the Support of the October Lows. The Strongest Leaders that are holding Above the Green Line should go back up to re-test the September Highs (see Long Term List below).
Investments that are struggling Below the Green Line should probably be Sold on the next rally.
For the week the Dow was up 5.16%, the S&P 500 was up 4.71%, and the Nasdaq 100 was up 6.46%. The Long Term Trend on the Stock Markets is UP.
The Inflation Index (CRB) was up 1.19% and is Below the Green Line, indicating Economic Weakness.
Bonds were up 0.17% for the week and are Below the Green Line, indicating Economic Strength.
The US DOLLAR was up 0.19%, and is currently over-bought.
Crude Oil was up 1.01% for the week at $50.93, and GOLD was unchanged at $1220.
___________________________________________________________________________________________
MONEY WAVE BUYS SOON:
We are currently in 6 logged Open Positions, for the Short & Medium Term. There are 4 Investments on the Short Term Watch List.
Be patient and WAIT for Green Zone Buy Signals!
______________________________________________________________________________________________
LONG TERM TRADES
Many on the Long Term List had large pops this week, so we don’t want to Chase them. Wait for the next Daily Money Wave Buy Signal. Investments below that can Bounce up off the Green Line with Above 80 Relative Strength, could re-test their recent Highs.
ADBE ADOBE SYSTEMS UP 11.2% for the week. Wait for the next Daily Money Wave Buy.
ARWR ARROWHEAD PHARMA. UP 11.7% for the week. Wait for the next Daily Money Wave Buy.
CVNA CARVANA CO. Wait for weekly Close Above the Red Line of $46.57 (50-day avg.)
FOSL FOSSIL GROUP Place Buy Stop Order above $24.28 on the Close.
FTNT FORTINET INC. Wait for weekly Close Above the Red Line of $75.64 (50-day avg.)
LULU LULULEMON ATHLETICA Wait for weekly Close Above the Red Line of $136.14 (50-day avg.)
OKTA OKTA, INC. UP 22.3% for the week. Wait for the next Daily Money Wave Buy.
QQQ NASDAQ 100 Fund Wait for weekly Close Above the Red Line of $170.52 (50-day avg.)
RUN SUNRUN, INC UP 18% for the week. Wait for the next Daily Money Wave Buy.
WWE WORLD WRESTLING UP 18% for the week. Wait for the next Daily Money Wave Buy.
___________________________________________________________________________________________
Click for Portfolio (Open Positions)
Click for Watch List
Click for Closed Positions
Alert! Market Risk is MEDIUM (Yellow Zone). The probability of successful Short Term Trades is better, when the S&P 500 is down near the Green Line.
Tell your Friends about the Green Line, and Help Animals.
QUESTION: Hi, on the portfolio page with the current positions, may i know what’s the parameters to shift the “legend” to yellow “Don’t take a loss!”? For eg. currently on the portfolio page, Square (SQ) is showing the yellow code legend at the moment.
Best regards, Rui.
ANSWER: Hi Rui. Usually after a Money Wave Buy Signal, the Investment should pop 3-5% in a few day (SQ popped over 5%). When the Money Wave is > 50 and the Investment is not continuing up, then something might be wrong (maybe the Market might not have bottomed).
So for Short Term Trading we suggest getting out Before you take a Loss, and try to get back in Lower at a later date.
Good trading, and tell your friends!


