Above the Green Line -01
  • Market Insights
        • Commentary
          • Daily
          • Weekly
        • BUY / SELL SIGNALS
          • Trade Posts
          • Recent Trade Alerts
          • Recent Day Trades
        • BLOGROLL
          • Dividend Growth Blog
          • ETF Sector Blog
          • Dow Dogs
          • TPOW Blog
  • Strategies
        • SWING TRADING
          • Current Positions
          • Watchlists
          • Closed Positions
          • Candidates - TOP 100
          • Specialty Stocks
        • WEEKLY STOCK PICK
          • TPOW Charts
          • TPOW Performance
          • TPOW Strategy Guide
          • TPOW Performance Dashboard
        • DAY TRADING
          • Watch List
        • ATGL DASHBOARD
        • ETF STRATEGIES
          • ETF Sector Rotation
          • ETF Sector Portfolio
        • DIVIDEND GROWTH
          • Dividend Growth Portfolio
          • Dividend Calendar
        • DOGS OF THE DOW
          • Dogs of the Dow Portfolio
          • DOW 5 Portfolio
  • Markets
        • US MARKET
          • Commodities
          • Energy
          • Precious Metals
          • Volatility
        • GLOBAL MARKETS
          • Market Indices
          • Economic Calendar
          • FOREX Heat Map
          • FOREX Cross Rates
          • Crypto Currency Market
  • Investing
    • Discord Community
    • Dashboard
  • Resources
        • ARTICLES
          • Dividend Growth Model Articles
          • ETF Articles
          • Investment Strategies Articles
          • Market and Economic Insights
          • Stock Trade Articles
          • Stock Reviews
        • TOOLS
          • Stock Scanners
          • Charting Software
          • Brokerage Firms
        • STOCK CHARTS
          • Key Components
          • Reading Charts
          • Drawing Stock Charts
          • Identifying Trends
        • RETIREMENT PLANNING
  • About
    • Contact Us
    • How to Win
    • #1 At Stockcharts
    • Disclaimer
    • FAQ
  • Log In
  • Subscribe

December 30, 2018

Green Line Weekly Dec 30, 2018

SPY Weekly
Possible Elliott Wave count on the S&P 500.


12/30/2018:  Markets  bounced up this week after being extremely Over-Sold.  Normally when the FEAR is so high and Tammy has sold out after Buying High, the media will begin to print positive stories (maybe like gasoline prices below $2, mortgage rates have dropped 3/4 -1%, maybe Earnings better than expected,  the FED becoming less Hawkish, a necessary China Trade deal, etc.)

And then in a few months the sentiment and confidence could flip, and eventually the Herd and Tammy would pile back in.  Eventually the Markets should bounce back up to at least the Green Line, once they bottom.

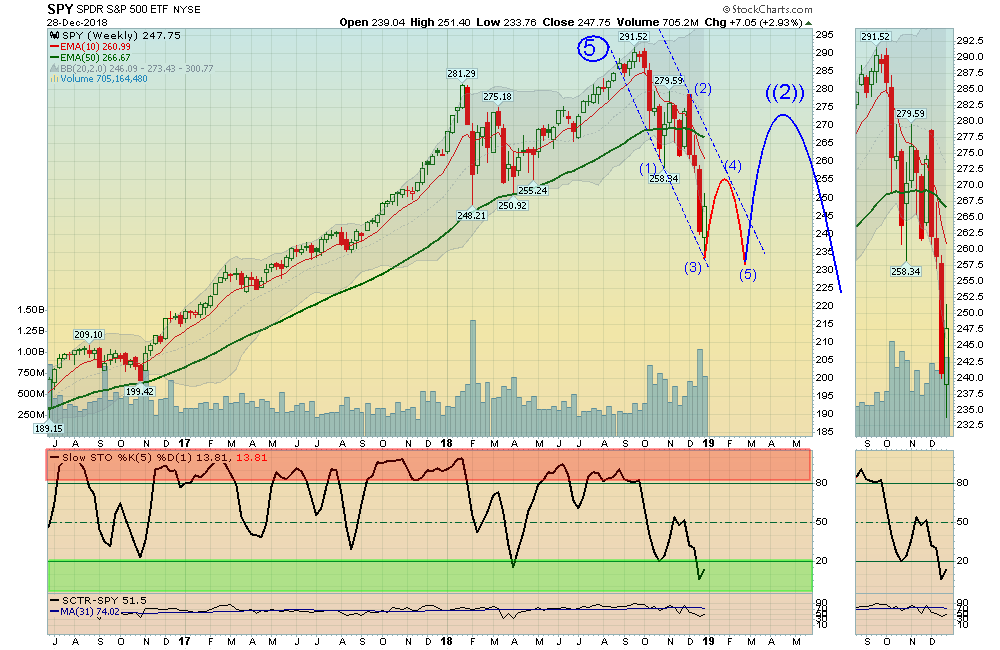
For the week the Dow was up 2.75%, the S&P 500 was up 2.93%, and the Nasdaq 100 was up 3.95%.   The very Long Term Trend on the Stock Markets is UP, but many Indices made 52-week Lows last week which could signal a Top has been made.


The Inflation Index (CRB) was down 0.68% and is Below the Green Line, indicating Economic Weakness.

Bonds  were up  0.27% for the week and are Above the Green Line, indicating Economic Weakness.

The US DOLLAR  was down 0.64%, and could be topping as the FED is probably finished Raising Rates for a while (unless they purposely  want to create a Slow Down). A falling Dollar could be good for Tech Stocks and Commodities.

Crude Oil was down 0.57% for the week at $45.33, and GOLD was up 2% at $1283.

___________________________________________________________________________________________

MONEY WAVE BUYS SOON:   

We are currently in 13 logged Open Positions, for the Short & Medium Term.  There are 3 Investments on the Short Term Watch List. 

Be patient and WAIT for Green Zone Buy Signals!

______________________________________________________________________________________________

LONG TERM TRADES 

Investments below that can Bounce up off the Green Line with Above 80 Relative Strength, could re-test their recent Highs.

   
ARWR    ARROWHEAD PHARMA.    Wait for weekly Close Above the Red Line of $13.29 (50-day avg.)   
BSX    BOSTON SCIENTIFIC     Wait for weekly Close Above the Red Line of $35.53 (50-day avg.) 
CGC    CANOPY GROWTH     Wait for weekly Close Above the Red Line of $32.96 (50-day avg.) 
FIVE    FIVE BELOW     Wait for weekly Close Above the Red Line of $103.93 (50-day avg.)       
FTNT    FORTINET INC.     Wait for weekly Close Above the Red Line of $72.48 (50-day avg.)   
I    INTELSAT GLOBAL     Wait for weekly Close Above the Red Line of $23.60 (50-day avg.) 
LULU    LULULEMON ATHLETICA     Wait for weekly Close Above the Red Line of $125.84 (50-day avg.)     
MSFT    MICROSOFT CORP.     Wait for weekly Close Above the Red Line of $104.66 (50-day avg.)     
UAL    UNITED CON’T. AIR     Wait for weekly Close Above the Red Line of $87.23 (50-day avg.)     
WWE    WORLD WRESTLING    Place Buy Stop above $77.95 on the Close.  

___________________________________________________________________________________________


Click for  Portfolio (Open Positions)  
Click for  Watch List
Click for  Closed Positions


Alert! Market Risk is LOW (Green Zone). The probability of successful Short Term Trades is better, when the S&P 500 is down near the Green Line. 

Tell your Friends about the Green Line, and Help Animals.


QUESTION:   Steve writes ” What is the deciding factor for you to say “Caution! Way above the Green Line?   Thank you.”

ANSWER:  Hi Steve, Way Above the Green Line means that if you Buy up there, you will probably have a “Sick Feeling” when the Investment eventually returns to the Green Line.

Good trading, and tell your friends!


Related Post

– Green Line Weekly Dec 23, 2018

Subscribe to Our Newsletter

AGL Logo

Get our eBook Now!

Candlestick - A Swing Traders Friend

We don’t spam! Read our privacy policy for more info.

You’ve been successfully subscribed to our newsletter!

Voted #1 at Stock Charts

SH Chart
Inverse S&P 500 Fund (SH) will have a Money Wave Buy today.

Help Us Help Animals

Help Us Help Animals

Recent Comments

  • Market Breadth Indicators: A Trader’s Guide to Early Trend Detection on Backtesting: Definition and How a Trading Strategy Backtest Works
  • Island Reversal Pattern: Definition and Formation Explained on Double Top Pattern: How to Identify and Trade This Reversal Signal
  • Channel Pattern Guide: What It Is and Why It Matters on A Guide to Forecasting Using Moving Averages
  • What Is a Broadening Bottom Chart Pattern? Full Guide on Bull vs. Bear Market: An Investor’s Guide to Market Phases
  • ATGL Weekly Money Flow - 2025-05-11 on ATGL Top Pick of the Week! Apr 6, 2025

Become a Green Liner!

Help me make more Money in the Stock Market.

ON ATGL

  • DashBoard
  • Weekly Commentary
  • Daily Buy / Sell Signals
  • Day Trade Setup
  • Trading Rooms

Design & Develop By Pixelvect

STRATEGIES

  • Swing Trading
  • ATGL Pick of the Week
  • Dividend Growth
  • ETF Sector Rotation
  • Dogs of the Dow

HELP

  • ATGL Trading Rules
  • FAQ
  • Account Maintenance
  • Contact US
  • Join

FOLLOW US

Instagram Linkedin Twitter Facebook

© COPYRIGHT 2024 · ABOVETHEGREENLINE.COM · ALL RIGHTS RESERVED · PRIVACY · TERMS · CONTACT · WATCHLIST · CURRENT